 According to the National Association of Home Builders (NAHB)/First American Leading Markets Index (LMI) for Q3 2016, the economic and housing markets are very close to “normal” levels but underlying variation in the components of the index indicate an uneven recovery nationwide.
The LMI, which uses single-family housing permits, employment, and home prices to measure how close economic and housing markets are to “normal” levels, stood at 0.98 percent in the third quarter—only 2 basis points off from the level of 1.0 percent which the index uses as the last “normal” level. Q3’s LMI was up by 1 basis point from Q2 and 5 basis points from a year earlier, and 20 points higher than its all-time low, reached in 2012.
In the third quarter, 91 percent of the 337 local markets tracked reported an over-the-year increase in their LMI value. Approximately 80 percent of local markets have an LMI value above 0.87 percent and 60 percent have a value equal to or greater than 95 percent.
According to the NAHB, 162 markets (48 percent) are now reported to be at or above the normal level. Historically, about half of the markets tracked are at their normal level when the national LMI reaches 1.0 percent.
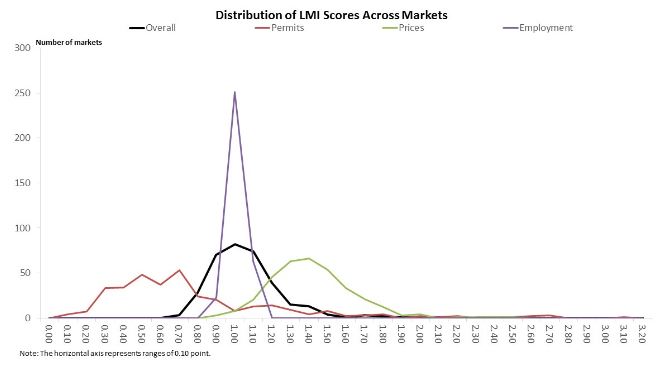
All three components of the national LMI rose slightly both over-the-quarter and over-the-year in Q3, but the housing permits component remained well below normal and well behind the other two components. In Q3, the house prices component increased over-the-year by 8 basis points to 1.45 percent, employment rose over-the-year by 2 basis points to 0.98 percent, and housing permits rose over-the-year by 4 basis points to 0.51 percent.
“The three underlying components of the LMI are at widely different stages of recovery,” said Michael Neal, Senior Economist with NAHB. “Nationwide, house prices have surpassed normal levels, employment is near normal, but permits are the laggard.”
Permits will need to pick up the pace in order for housing to overcome its months-long inventory shortage. According to National Association of Realtors Chief Economist Lawrence Yun, the forecasted increase in housing starts in 2017 up to 1.22 million is still less than the 1.5 million needed to make up for the inventory shortage in recent years—and to keep up with increasing demand.
“Multi-family housing construction has dominated the building landscape in recent years and only recently started to level off,” Yun said. “Hopefully this is a sign that homebuilders will begin to significantly shift their focus to single-family housing. Both a large bump in new homes and homeowners selling is needed to get supply levels at healthier levels.”
Click here to view the NAHB/First American Leading Markets Index for the third quarter of 2016 with a market by market breakdown.