


 The threat of rising rates may be the metaphorical “kick-in-the-pants" many need to enter the purchasing market as the threat of rising rates topped with inflation will be a driving force keeping demand high during a time of year that typically sees a major cool-off.
First American Financial Corporation has released its latest iteration of their Real House Price Index (RHPI) for November, which measures the price changes of single-family properties across national, state, and metropolitan areas, which are adjusted based on income, interest rates, and home-buying power. The ultimate goal of this is to provide a clearer picture of housing affordability
According to First American, the three key points of the First American RHPI are income, mortgage rates and an unadjusted house price index. Incomes and mortgage rates are used to inflate or deflate unadjusted house prices in order to better reflect consumers' purchasing power and capture the true cost of housing.
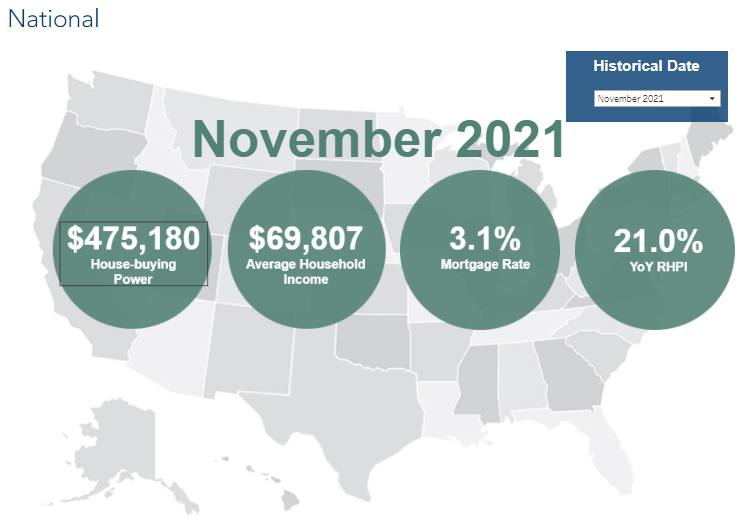
All-in-all, for the month of November, First American found that real house prices increased by 21.0% year-over-year or 1.5% from October. It also found that the average house now costs $475,180 up $2,818 from $472,362 in October while the average household income is $69,807, up by $414 from $69,393.
“In November, year-over-year nominal house price appreciation reached 21.5%, the sixth consecutive month it has set a new record. According to our Real House Price Index—which measures housing affordability based on changes in income, interest rates and nominal house prices—affordability declined 21.0% compared with a year ago, as the growth in nominal house prices combined with the 30-basis point increase in the 30-year, fixed mortgage rate vastly outpaced the 4.4% increase in income,” said Mark Fleming, Chief Economist at First American. “Affordability is likely to decline further in 2022, because both mortgage rates and nominal house prices are expected to rise.”
Late last year, the Federal Reserve signaled through a series of monetary moves that interest rates will be rising this year in the face of declining affordability and rising inflation. This period of “easy money” could end as soon as March. Still, mortgage rates remained flat between October and November sitting at 3.1%.
“The Federal Reserve has signaled the end of the easy money era is near. In order to combat inflation, the Fed is expected to increase rates as soon as March. Mortgage rates typically follow the same path as long-term bond yields, which are expected to increase due to the Fed’s tightening of monetary policy, higher inflation expectations and an improving economy,” said Fleming. “The consensus among economists is that the 30-year, fixed mortgage rate will increase from its November rate of 3.1% to 3.7% by the end of 2022. Some forecasters predict rates will reach 4%, which is still historically low, but well above what buyers have grown accustomed to in recent years.”
But as rates rise, affordability concerns begin to become more prevalent.
“We can use the RHPI to model shifts in income and interest rates and see how they either increase or decrease consumer house-buying power and affordability,” said Fleming. “When mortgage rates increase, holding income constant, consumer house-buying power decreases.
“If the average mortgage rate remained at its current level of approximately 3.5% through the spring home-buying season, assuming a 5% down payment and holding average household income constant at the November 2021 level of $69,800, house-buying power falls by approximately $25,000,” said Fleming. “If rates increase to the anticipated end of 2022 level of 3.7%, house-buying power would fall by $36,000. Finally, if mortgage rates reach 4% as some industry experts anticipate, house-buying power would fall by nearly $52,000 compared with November 2021.
“Rising mortgage rates impact affordability, but one of the root causes of rising mortgage rates is an improving economy, and an improving economy often leads to stronger wage growth. Rising household income can blunt the negative impact that higher rates have on house-buying power,” said Fleming. “In fact, our estimate of average household income increased approximately 0.6 percent on a monthly basis in November 2021. If incomes continue to increase at this rate through the end of 2022, the income growth would reduce the projected end-of-year 2022 decrease in house-buying power to just $700, instead of $36,000.”
In addition, fear of missing out (FOMO) will force the hands of those sitting on the sidelines to enter the market so they can take advantage of rates while they are still low.
“While rates are expected to increase steadily throughout 2022, many potential home buyers may try to jump into the market now before rates rise further. The fear of missing out, or 'FOMO,' on low rates and the potential loss of house-buying power may supercharge the housing market ahead of the spring home-buying season,” said Fleming. “However, housing supply tends to increase in the spring months as more sellers list their homes for sale. While home buyers may have FOMO because of rising rates, they may not want to succumb to the fear of better options, or 'FOBO,' because there may be a better home option or options when there’s more homes for sale, even if it means they may pay more.”
Other highlights found by the report include:
- Consumer house-buying power, how much one can buy based on changes in income and interest rates, increased 0.6 percent between October 2021 and November 2021, and increased 0.4 percent year over year.
- Median household income has increased 4.4 percent since November 2020 and 68.0 percent since January 2000.
- Real house prices are 5.6 percent less expensive than in January 2000.
- While unadjusted house prices are now 42.7 percent above the housing boom peak in 2006, real, house-buying power-adjusted house prices remain 33.8 percent below their 2006 housing boom peak.
- The five states with the greatest year-over-year increase in the RHPI are: Arizona (+33.1 percent), South Carolina (+28.1 percent), Florida (+28.0), Georgia (+27.4 percent), and Connecticut (+26.2),
- There were no states with a year-over-year decrease in the RHPI.
- Among the Core Based Statistical Areas (CBSAs) tracked by First American, the five markets with the greatest year-over-year increase in the RHPI are: Phoenix (+34.6 percent), Charlotte, N.C. (+34.0), Tampa, Fla. (+32.0 percent), Atlanta (+30.0 percent) and Jacksonville, Fla. (+29.6 percent).
- Among the Core Based Statistical Areas (CBSAs) tracked by First American, there were no markets with a year-over-year decrease in the RHPI.


