 The Mortgage Bankers Association [1] (MBA) has launched a new affordability index aiming to measure how new mortgage payments vary across time relative to their income.
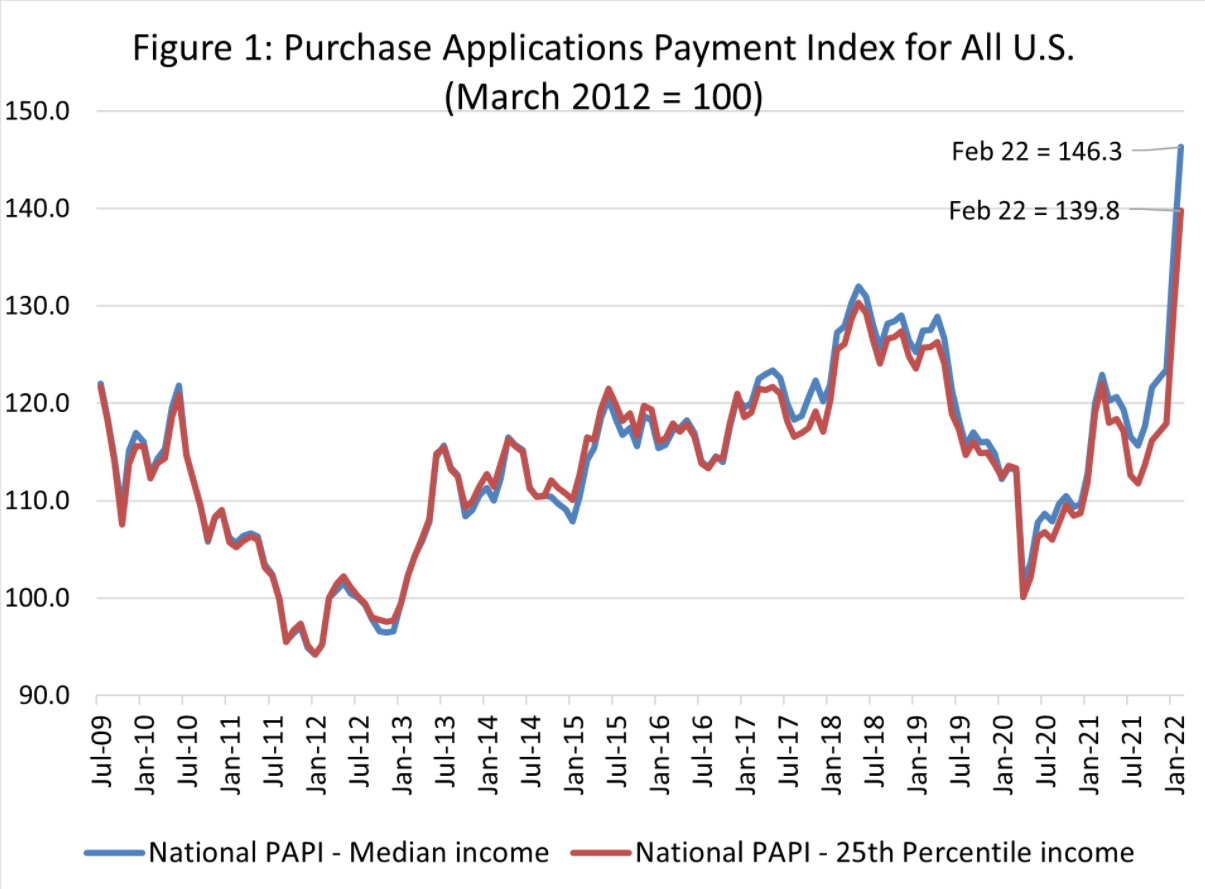
The new monthly index, called the Purchase Applications Payment Index [2] (PAPI), is used because an index can simplify the measurement of changes in the underlying data series over time.
While new, the MBA has worked backward from today to July 2009 in order to give the index a solid starting foundation built on historical data. The PAPI uses data from the MBA’s Weekly Applications Survey [3] (WAS) that uses loan-level data on 30-year fixed-rate mortgages to get the loan amount and interest rate needed to calculate monthly loan payments. It then uses data from the U.S. Bureau of Labor and Statistics [4] Current Population Survey [5] (updated quarterly and conducted by the U.S. Census Bureau [6]) and the Employment Situation Report [7] (updated monthly) to find full-time wage and salary earnings before taxes. It also benchmarked the index to 100 with the March 2012 data.
It should be noted that the PAPI is a national survey which also provides glimpses into data by race and ethnicity, but is limited by WAS data which does not take race/ethnicity into consideration.
So what drives the index up or down? According to the MBA, the PAPI will increase as mortgage application loan amounts increase, as interest rates on mortgages rise, or if earnings decline. On the other hand, the PAPI decreases when loan amounts decrease, interest rates decline, or earnings increase.
A component of the index also compares rent levels to mortgage payments. To do this the MBA compares the 25th percentile and median WAS payment level data to rents for each quarter since July 2009 using the U.S. Census Bureau’s Housing Vacancies and Homeownership survey to find the median asking rent.
So what did the first PAPI find? The national PAPI increased 8.3% to an index of 146.3 in February 2022 from the 135.1 in January 2022 and from 120.0 the previous February (a 21.9% increase). This is equivalent to a $127 jump in payments month to month and $337 jump from a year ago.
“Low unemployment has spurred strong income growth in early 2022, but homebuyer affordability has decreased due to the quick rise in mortgage rates amidst steep home-price growth,” said Edward Seiler [8], MBA's Associate Vice President, Housing Economics, and Executive Director, Research Institute for Housing America. “The 30-year fixed-rate mortgage spiked 73 basis points from December 2021 through February 2022. Together with increased loan application amounts, a mortgage applicant’s median principal and interest payment in February jumped $127 from January and $337 from one year ago.”
The MBA found the national median mortgage payment according to new applications for February 2022 stands at $1,653, up from $1,526 in January and $1,316 a year prior. The median payment for an FHA loan was found to be $1,201 (up from $1,009 a year ago); a median payment for a conventional loan was $1,749 (up from $1,391 a year ago).
Mirroring a rise in median mortgage application payments, median asking rents increased 1.15%, meaning mortgage payments for home purchases have increased relative to rents. The index found the national median asking rent during the fourth quarter of 2021 was $1,207
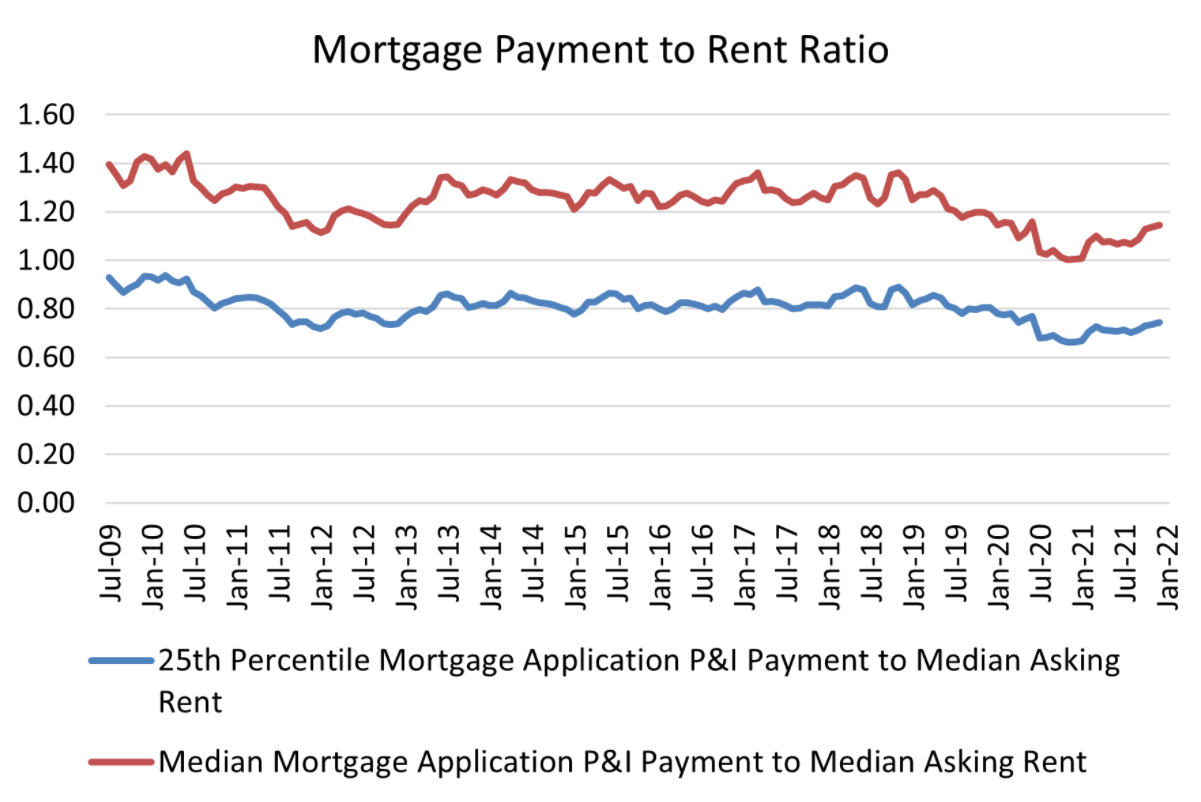
“Asking rents from first-quarter 2020 to fourth-quarter 2021 increased 16%, even outpacing the steep growth in mortgage application payments over that period,” Seiler added. “MBA’s mortgage payment to rent ratio is now at roughly the same level it was at the start of the COVID-19 pandemic in March 2020.”

Other notable data found by the report includes:
- The top five states with the highest PAPI were: Idaho (221.3), Nevada (216.5), Arizona (189.4), Utah (181.6), and Washington (180.4).
- The top five states with the lowest PAPI were: Washington, D.C. (86.3), Connecticut (91.8), Alaska (94.8), Iowa (101.2) and Wyoming (104.1).
- Homebuyer affordability decreased for Black households, with the national PAPI increasing from 140.0 in January to 151.6 in February.
- Homebuyer affordability decreased for Hispanic households, with the national PAPI increasing from 125.9 in January to 136.4 in February.
- Homebuyer affordability decreased for White households, with the national PAPI increasing from 136.6 in January to 147.9 in February.\
Being a new survey, the MBA may change the methodology of this index in the future in the coming months based on feedback. To submit comments or feedback, contact the MBA directly at [email protected]. [9]