


 It is no secret that the COVID-19 pandemic affected nearly every facet of the economy and the people that live in it. But the pandemic didn’t affect everyone equally—Americans of color, most notably Black Americans, have been disproportionately affected by the pandemic which exacerbated racial income and wealth inequality among those in that group.
Black Americans are already among the most economically disadvantaged groups in the nation, according to Jacob Channel, the Senior Economic Analyst for LendingTree, and knowing this, LendingTree published a new study focusing on homeownership rates for Black Americans.
The study, which uses newly released U.S. Census Bureau data, found that Black Americans own a disproportionately small amount of homes in the top 50 metropolitan areas when comparing the share of homes owned by those who identify as Black to the population of Black residents in each metro.
As a whole, Black Americans make up 15% of the population across the top 50 metropolitan statistical areas (MSAs) but only own 10% of owner-occupied homes. For comparison, white Americans account for 64% of the population—yet they own 76% of owner-occupied houses.
The report also found that Black Americans tend to make up a larger share of the population in metros with the largest differences between the percentage of Black owner-occupied homes and the portion of the population that identifies as Black. In contrast, areas with smaller Black populations often see more proportionate homeownership rates among Black residents.
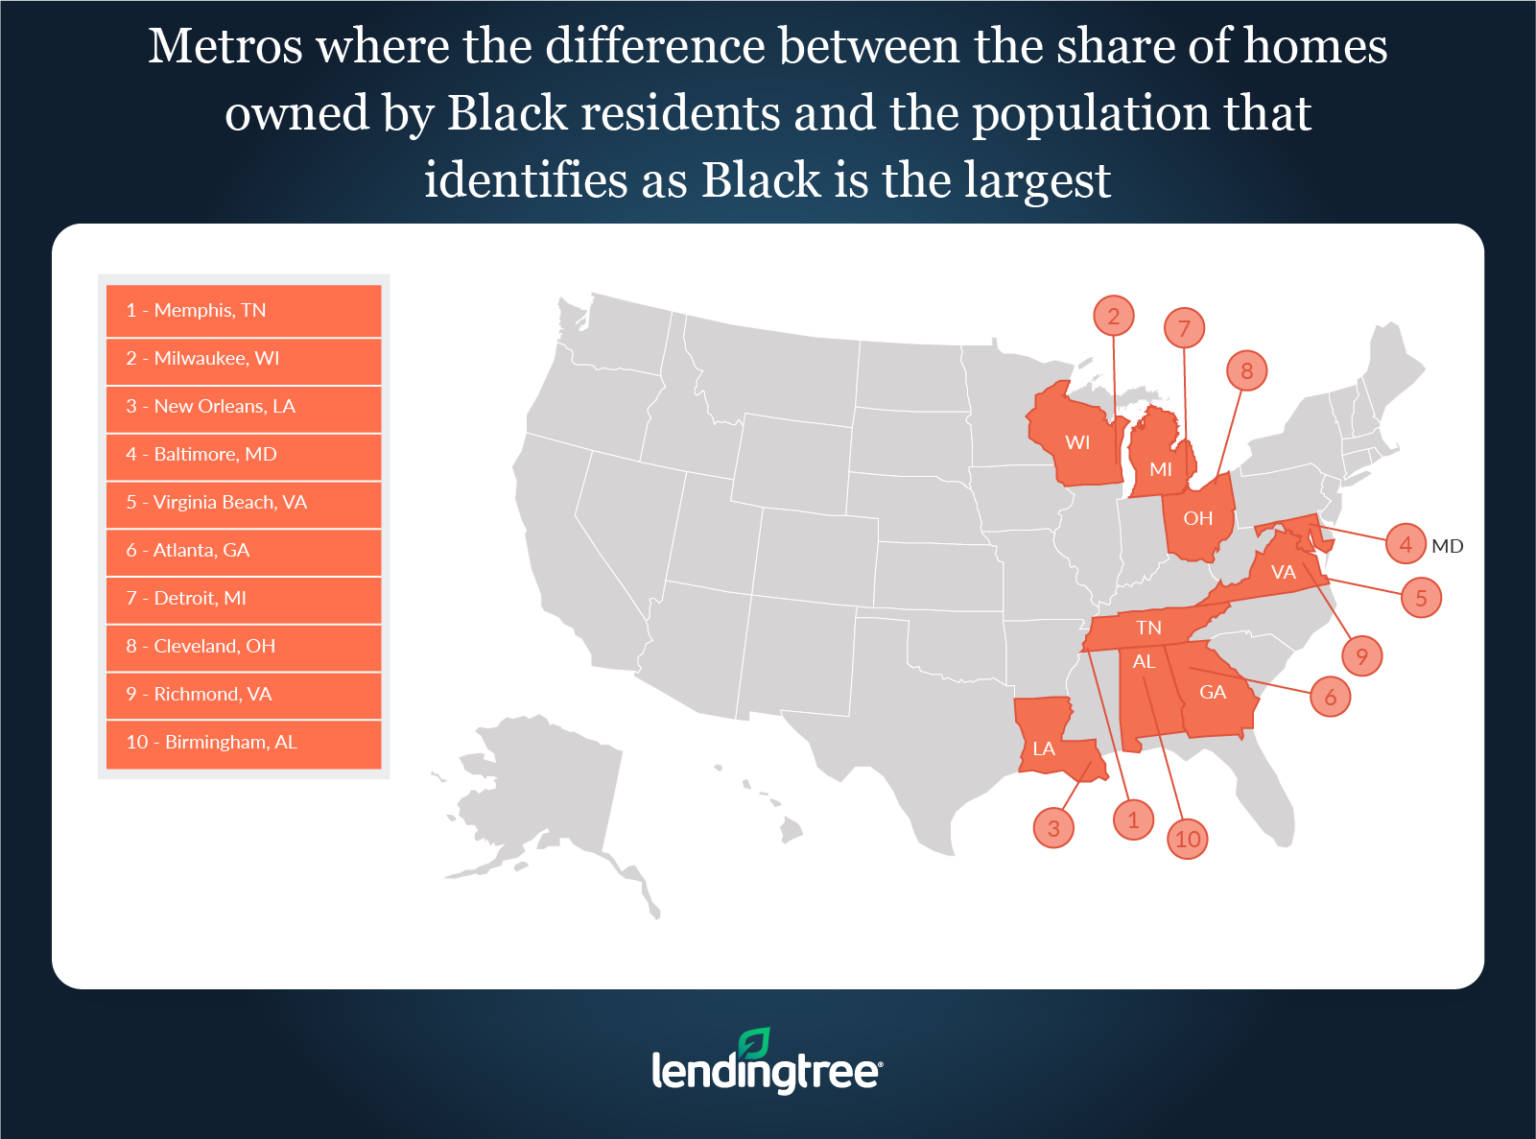
The top 10 MSAs where the difference between the share of homes owned by Black residents and the population that identifies as Black is the largest are:
- Memphis, Tennessee
- Percentage of the population that identifies as Black: 47.37%
- Percentage of Black owner-occupied homes: 35.05%
- Difference: -12.32%
- Milwaukee, Wisconsin
- Percentage of the population that identifies as Black: 16.47%
- Percentage of Black owner-occupied homes: 6.51%
- Difference: -9.96%
- New Orleans, Louisiana
- Percentage of the population that identifies as Black: 34.98%
- Percentage of Black owner-occupied homes: 25.63%
- Difference: -9.35%
- Baltimore, Maryland
- Percentage of the population that identifies as Black: 29.30%
- Percentage of Black owner-occupied homes: 20.07%
- Difference: -9.23%
- Virginia Beach, Virginia
- Percentage of the population that identifies as Black: 30.29%
- Percentage of Black owner-occupied homes: 21.51%
- Difference: -8.78%
- Atlanta, Georgia
- Percentage of the population that identifies as Black: 34.19%
- Percentage of Black owner-occupied homes: 25.77%
- Difference: -8.42%
- Detroit, Michigan
- Percentage of the population that identifies as Black: 21.95%
- Percentage of Black owner-occupied homes: 13.58%
- Difference: -8.38%
- Cleveland, Ohio
- Percentage of the population that identifies as Black: 19.63%
- Percentage of Black owner-occupied homes: 11.34%
- Difference: -8.28%
- Richmond, Virginia
- Percentage of the population that identifies as Black: 29.38%
- Percentage of Black owner-occupied homes: 21.26%
- Difference: -8.12%
- Birmingham, Alabama
- Percentage of the population that identifies as Black: 30.08%
- Percentage of Black owner-occupied homes: 22.24%
- Difference: -7.84%
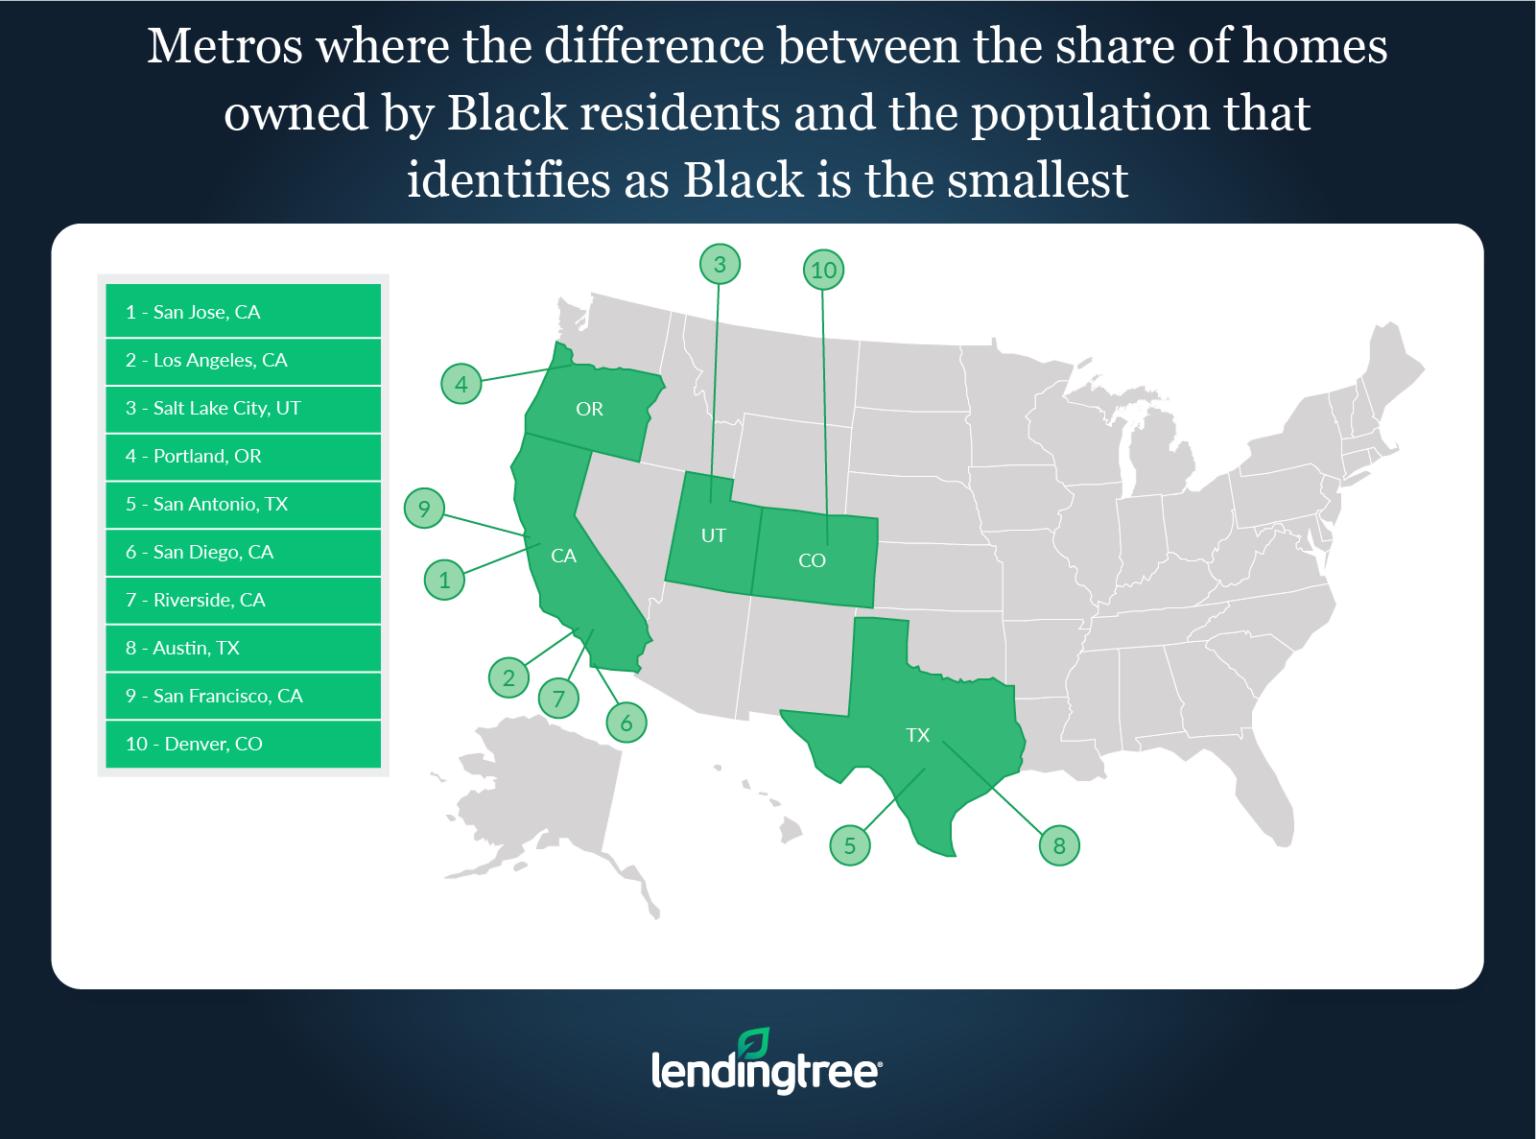
The top 10 metros with smallest differences between the share of homes owned by Black residents and the population that identifies as Black are:
- San Jose, California
- Percentage of the population that identifies as Black: 2.41%
- Percentage of Black owner-occupied homes: 1.38%
- Difference: -1.03%
- Los Angeles, California
- Percentage of the population that identifies as Black: 6.54%
- Percentage of Black owner-occupied homes: 5.24%
- Difference: -1.31%
- Salt Lake City, Utah
- Percentage of the population that identifies as Black: 1.88%
- Percentage of Black owner-occupied homes: 0.56%
- Difference: -1.32%
- Portland, Oregon
- Percentage of the population that identifies as Black: 2.86%
- Percentage of Black owner-occupied homes: 1.45%
- Difference: -1.40%
- San Antonio, Texas
- Percentage of the population that identifies as Black: 6.77%
- Percentage of Black owner-occupied homes: 4.93%
- Difference: -1.84%
- San Diego, California
- Percentage of the population that identifies as Black: 2.41%
- Percentage of Black owner-occupied homes: 1.38%
- Difference: -1.03%
- Riverside, California
- Percentage of the population that identifies as Black: 7.27%
- Percentage of Black owner-occupied homes: 5.17%
- Difference: -2.10%
- Austin, Texas
- Percentage of the population that identifies as Black: 7.29%
- Percentage of Black owner-occupied homes: 5.11%
- Difference: -2.19%
- San Francisco, California
- Percentage of the population that identifies as Black: 7.21%
- Percentage of Black owner-occupied homes: 4.87%
- Difference: -2.34%
- Denver, Colorado
- Percentage of the population that identifies as Black: 5.71%
- Percentage of Black owner-occupied homes: 3.28%
- Difference: -2.43%
So, what is driving these trends? For one, income. According to Channel, the median household income for those who identify as Black is $45,870. That is almost $30,000 less than the $74,912 median income for white households.
Income is not the only thing driving these trends, other things that contribute to this are the low amount of household wealth typically accumulated by Black households, the fact they often have greater difficulty accessing traditional banking and credit services, and are more likely to be denied a mortgage than members of other races.
“Further, the legacies of historical policies meant to disenfranchise Black homebuyers, like “redlining,” have had a long-lasting impact that still contributes to the disproportionately low homeownership rates among Black Americans today,” Channel concluded. “With that said, it’s important to note that while these examples can shed some light on why homeownership rates are relatively low for Black Americans, they’re not all the reasons why a person who identifies as Black may struggle to become a homeowner. And, ultimately, a wide variety of socioeconomic factors continue to drive this unfortunate trend.”
Click here to view a full copy of the report, including data for the top 50 cities.


