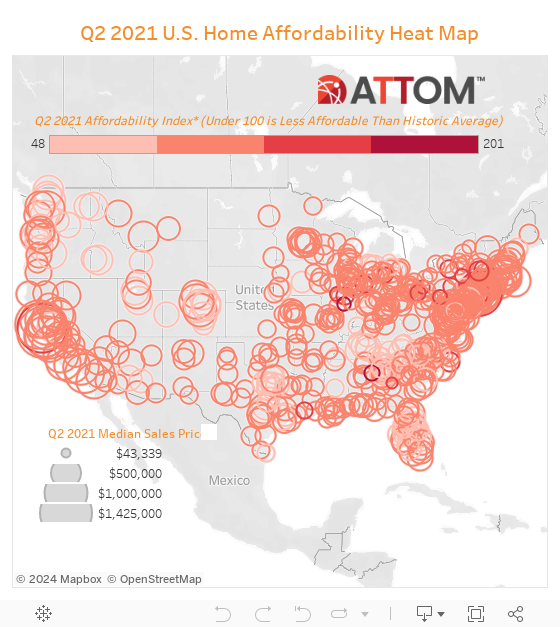
 ATTOM’s second-quarter 2021 U.S. Home Affordability Report [1] shows that median home prices of single-family homes and condos in the Q2 of 2021 are less affordable than historical averages in 61% of counties across the nation. This total is up from 48% of counties in Q2 of 2020, to the highest point in two years, as home prices have increased faster than wages in much of the nation.
Compared to historical levels, median home prices in 347 of the 569 counties analyzed by ATTOM in Q2 [2] are less affordable than past averages. The latest number is up from 275 of the same group of counties in the second quarter of 2020—a backslide that developed amid a 22% spike in the median national home price over the same period last year to a record of $305,000.
The latest pattern–home prices still manageable, but getting less affordable–has resulted in major ownership costs on the typical home consuming 25.2% of the average national wage of $63,986 in Q2. That is up from 22.7% in Q1 of 2021 and 22.2% in Q2 of last year, to the highest point since Q3 of 2008. Still, the latest level is within the 28% standard lenders prefer for how much homeowners should spend on mortgage payments, home insurance, and property taxes.
The costs of ownership
Major ownership costs on median-priced homes in Q2 of 2021 consumes less than 28% of average local wages in 327 of the 569 counties analyzed in this report (57%). Counties requiring the smallest portion are:
- Schuylkill County, Pennsylvania (outside Allentown) (5.5% of annualized weekly wages needed to buy a home)
- Bibb County (Macon), Georgia (8% of annualized weekly wages needed to buy a home)
- Cambria County, Pennsylvania (outside Pittsburgh) (8.2% of annualized weekly wages needed to buy a home)
- Macon County (Decatur), Illinois (9.1% of annualized weekly wages needed to buy a home)
- Peoria County, Illinois (10.4% of annualized weekly wages needed to buy a home)
A total of 242 counties in the report (43%) required more than 28% of annualized local weekly wages to afford a typical home in Q2. Counties that required the greatest percentage of wages include:
- Kings County (Brooklyn), New York (100.8% of annualized weekly wages needed to buy a home)
- Marin County, California (outside San Francisco) (81.4% of annualized weekly wages needed to buy a home)
- Santa Cruz County, California (76.2% of annualized weekly wages needed to buy a home)
- Queens County, New York (68.7% of annualized weekly wages needed to buy a home)
- Monterey County, California (outside San Francisco) (65.9% of annualized weekly wages needed to buy a home)
Home prices
Median single-family home prices in Q2 are up by at least 10% from Q2 of 2020 in 348 of the 569 counties (61%) included in the report. Counties were included if they had a population of at least 100,000 and at least 50 single-family home and condo sales in Q2.
Among the 43 counties with a population of at least one million, the biggest year-over-year gains in median prices during Q2 include:
- San Bernardino County, California (+25%)
- Mecklenburg County (Charlotte), North Carolina (+24%)
- Maricopa County (Phoenix), Arizona (+21%)
- Hillsborough County (Tampa), Florida (+20%)
- Middlesex County (outside Boston), Massachusetts (+20%)
Counties with a population of at least one million that have the smallest year-over-year increases (or price declines) in Q2 are:
- New York County (Manhattan), New York (-21%)
- Wayne County (Detroit), Michigan (-2%)
- Bronx County, New York (+2%)
- Kings County (Brooklyn), New York (+3%)
- Santa Clara County (San Jose), California (+4%)
Price gains vs. wage growth
Home-price appreciation was greater than annualized wage growth in Q2 in 409 of the 569 counties analyzed (72%), with the largest including:
- Los Angeles County, California
- Harris County (Houston), Texas
- Maricopa County (Phoenix), Arizona
- San Diego County, California
- Orange County, California (outside Los Angeles)
Average annualized wage growth outpaced home-price appreciation in Q2 in 160 of the 569 counties in the report (28%), including:
- Cook County (Chicago), Illinois
- Kings County (Brooklyn), New York
- Bexar County (San Antonio), Texas
- Santa Clara County (San Jose), California
- Wayne County (Detroit), Michigan
Click here [1] to view more of ATTOM’s 2021 U.S. Home Affordability Report for Q2.