According to a new report from Redfin, mortgage rates are climbing at the fastest pace in history, sending the typical monthly mortgage payment for a homebuyer up more than $500 since the beginning of 2022.
Fewer people are starting online home searches and applying for mortgages than this time last year, and year-to-date growth in home tours remains far below 2021 levels. An increasing share of sellers are also reducing their prices after putting their homes on the market. The share of homes that sell quickly (within 14 days) continues to grow, but at a slower pace than earlier this year.
“Homebuyers may not feel like the market has gotten any easier. That’s because they’re often competing against investors, all-cash buyers and migrants from expensive cities who aren’t as sensitive to mortgage rates,” said Redfin Chief Economist Daryl Fairweather. “But there are early indicators that the market is turning, and we expect the softening to become more apparent in the coming weeks, eventually causing home-price growth to slow. We’ll be watching closely to see whether the market slows from 100 miles per hour to 90 or 100 miles per hour to 75.”
Redfin agents say they’re starting to see some sellers put their homes up for sale earlier than planned because they’re worried they’ll miss out on the market’s peak if they wait.
“I’m starting to see early signs that the housing market is letting off some steam—something I wouldn’t have said a month ago,” said Aaron McCarty, a Redfin real estate agent in the Bay Area. "Bidding wars are still common, but homes that would have brought in 10 or more offers earlier this year are now getting half that many. Homes also aren’t selling as astronomically over the asking price as before. A house that might’ve gone for $700,000 over the list price two months ago may now go for $300,000 or $400,000 over. That's not the case every time, but I'm finding more opportunities for my clients where the competition is a bit more manageable.”

Key housing market takeaways for 400+ U.S. metro areas:
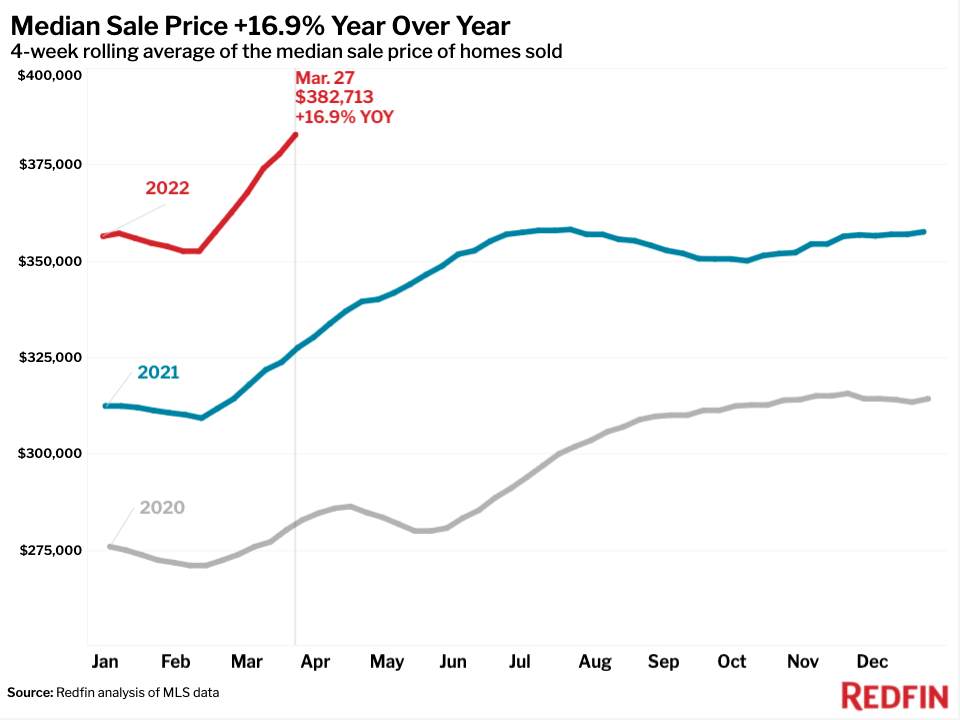
- The median home sale price was up 17% year over year to a record high of $382,713. That’s the biggest jump since the four weeks ending Aug. 1, 2021.
- The median asking price of newly listed homes increased 15% year over year to a record high of $399,450. That marks a slowdown from February, when asking prices were rising at an annual rate of roughly 16%.
- The monthly mortgage payment on the median asking price home rose to a record high of $2,234 at the current 4.67% mortgage rate. This was up 31% from a year earlier, when mortgage rates were 3.18%. The typical monthly mortgage payment is up $537 since the start of the year.
- Pending home sales were up 0.7% year over year, little changed from the 0.1% decline during the four weeks ending March 20, 2022.
- New listings of homes for sale were down 7% from a year earlier, the biggest drop since the four weeks ending Feb. 13, 2022.
- Active listings (the number of homes listed for sale at any point during the period) fell 22% year over year to 475,800—the fifth-lowest level on record. That’s just shy of the all-time low of 473,700 hit a month earlier.
- A record 59% of homes that went under contract had an accepted offer within the first two weeks on the market, up 4 percentage points from a year earlier. This metric’s rate of growth has slowed from a month ago, when it was up nearly 6 percentage points year over year.
- A record 45% of homes that went under contract had an accepted offer within one week of hitting the market, up 3 percentage points from a year earlier. This metric’s rate of growth has slowed from a month ago, when it was up 4 percentage points year over year.
- Homes that sold were on the market for a median of 20 days, down from 29 days a year earlier and a record low for this time of year.
- 51% of homes sold above list price, up from 40% a year earlier and the highest share since the four weeks ending Aug. 15, 2021.
- On average, 3% of homes for sale each week had a price drop, up 0.6 percentage points from a year ago. This metric’s rate of growth has increased from a month ago, when it was up 0.3 percentage points year over year.
- The average sale-to-list price ratio, which measures how close homes are selling to their asking prices, rose to 102%. In other words, the average home sold for 2% above its asking price. That’s up from 100.2% a year earlier and is the highest level since the four weeks ending Aug. 1, 2021.
To view the full report, including charts and methodology, click here [1].