


According to the Realtor.com Monthly Housing Trends Report, new data suggests that the U.S. housing supply is preparing to rebound, as active listings posted the smallest year-over-year declines —down just -12.2% since December 2019.
Inventory improvements were led by increases in the share of mid-sized homes, meaning more listings may be available to families looking to upgrade from their starter homes, potentially resulting in an uptick in first-time buying options.

"April data suggests a positive turn of events is on the horizon for weary buyers: If the trends we're seeing now hold true, we could potentially see year-over-year inventory growth within the next few weeks," said Danielle Hale, Chief Economist for Realtor.com. "The key to this growth will be the continuation of softening buyer competition and an increasing number of sellers putting homes on the market. While home shoppers are still seeking relief from record-high asking prices and all-time low supply, when compared to the past two-plus years of double-digit annual inventory declines, an imminent rebound is welcome news – a real estate refresh, if you will. There's a long uphill climb to balance, but it starts with heading in the right direction, and April data shows a lot of promise."
In April, the U.S. supply of for-sale homes showed multiple signs of accelerated improvements, as higher mortgage rates cut into some buyers' flexibility to compete. Although new listings declined year-over-year, so did the number of homes under contract, suggesting that softening demand is cooling the intense pace of home sales. As a result of these combined trends, the gap in active listings from last year continued to shrink, led by increases in the share of mid-sized homes. This could mean more options available to families looking to upgrade from and sell their starter homes, which could potentially lead to an increase in critical first-time buying inventory.
For all buyers still shopping, the continuation of these trends would likely mean some sooner-than-expected relief in available options. Inventory could hit annual growth by next month and begin the long road to full recovery from COVID declines.
Key Takeaways from 400+ Metros:
- The U.S. inventory of active listings was down 12.2% year-over-year in April, an improvement over March (-18.9%) and the smallest annual decline since December 2019 (-12.7%). Among this supply, the share of mid-sized (1,750-3,000 square foot) homes posted the biggest gain, up 2.34 percentage points year-over-year (see table below).
- Nationally, pending listings were down 9.5% year-over-year, a potential side effect of moderating demand on the pace of inventory turnover. These trends reflect intensifying cost pressures faced by buyers, with the cost of financing 80% of the typical home listing up by almost 50% compared to a year ago.
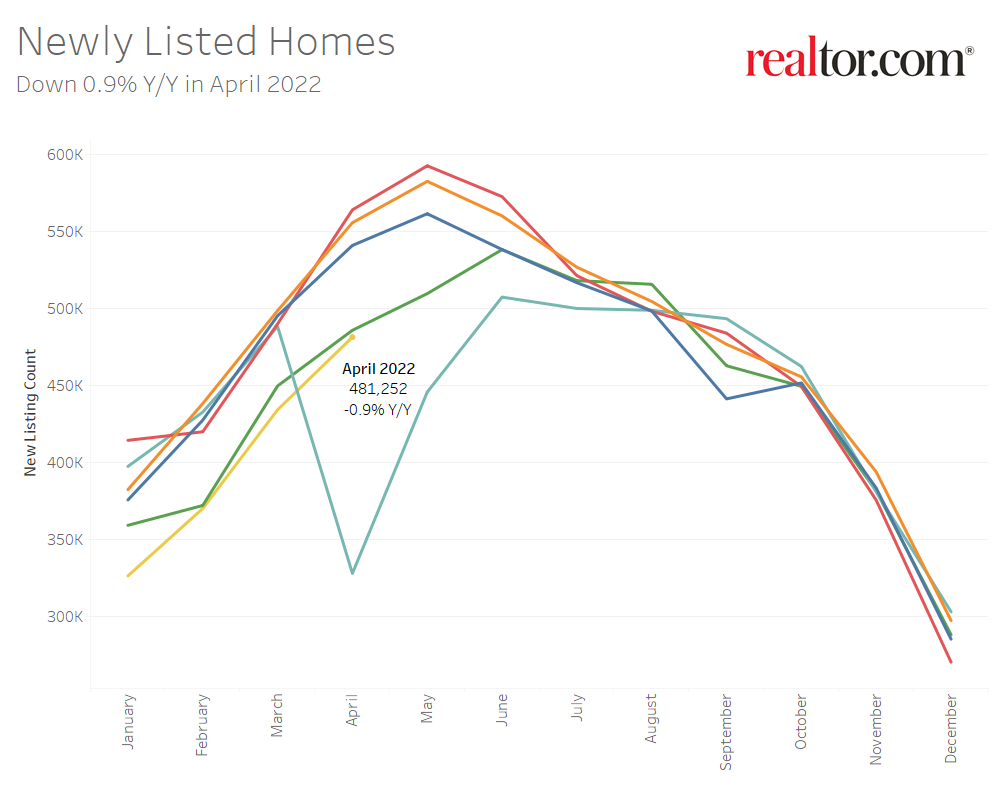
- New listings gained some momentum in April, but ultimately ended the month slightly below last year's level (-0.9%) and 13.0% lower than typical April levels from 2017-2019.
- Compared to the national rate, active listings declines from April 2021 were relatively smaller in the 50 largest metros, on average (-10.3%), and hit positive territory in eight markets, led by Riverside, Calif. (+23.3%), Austin, Texas (+16.5%) and Sacramento, Calif. (+11.8%).
- Seventeen metros posted year-over-year gains in newly-listed homes, topped by New Orleans (+15.2%), San Antonio (+12.5%) and Denver (+11.3%).
For buyers still in the market, softening competition is offering much-needed relief from the extreme pace that inventory is moving compared to last year. Homes continue to sell quickly, at a record-fast pace in April, but the gap from last year has been shrinking. In fact, the yearly rate dropped by half from March. Conditions were relatively more competitive in the 50 largest U.S. metros, all of which posted yearly declines in time on market. Many of the metros where homes moved fastest compared to last year were in the Sun Belt region, which has become increasingly popular with prospective buyers from other states.
In April, the typical U.S. home spent 34 days on market, six days less than last year and beating the previous record-low of 36 days in June 2021. Average time on market in the 50 largest U.S. metros was 28 days, six days fewer than last year. Regionally, the South posted the biggest year-over-year declines in time on market (-9 days), followed by the West (-5 days).
At the metro-level, homes moved at the fastest year-over-year pace were in:
- Miami (-29 days)
- Louis (-15 days)
- Raleigh, North Carolina (-14 days)
- Orlando, Florida (-13 days)
- Hartford, Connecticut (-13 days)
Despite moderating demand, the U.S. median home price hit yet another all-time high and accelerated over the March annual growth pace in April. While already elevated, this increase may be lower than what some home shoppers experienced, because medians can shift along with the mix of for-sale inventory.
April's median reflects fewer large listings and more mid-sized listings available compared to a year ago, with listing prices per square foot rising at a relatively faster pace than the overall median, but moderating slightly from the March rate. In another sign of some buyers tightening their budgets due to rate hikes, the share of sellers making price reductions increased year-over-year nationwide and in most large metros.
- The median national home price hit a new all-time high of $425,000 in April, up 14.2% year-over-year. While overall asking prices accelerated over last month's pace (13.5%), the annual growth rate declined on a square foot basis, to 15.1% from 15.7% in March.
- Nationally, the share of homes with price reductions increased 1.3 percentage points year-over-year to 6.9%, but lagged behind typical 2017 to 2019 levels (-9 percentage points).
- In April, listing prices in the 50 largest U.S. metros grew at a single-digit pace (+9.5%), on average. However, asking prices per square foot increased by double-digits (+12.3%) and closer to the national rate overall.
- Western (+14.5%) and southern (+14.1%) metros topped the list of biggest year-over-year price increases, up 22% or more in Miami, Las Vegas, Orlando, Fla., Tampa, Fla., Austin, Nashville, Tenn., Jacksonville, Fla. and Phoenix.
- In 40 of the 50 largest metros, the share of listings to which price reductions were made in the month of April increased year-over-year, by the most percentage points in: Austin (+6.8), Las Vegas (+5.3) and Sacramento (+4.7).
To read the full report, including charts and methodology, click here.


