According to a new report from Realtor.com [1], single-family homes were being both started and completed at the fastest pace in the last decade in the second half of 2021, with early 2022 continuing the previous year’s trend until the middle part of the year, when the market felt the impact of the ascent of mortgage rates. In response, red-hot buyer demand cooled and builders started to pull back on single-family home starts, though completions continued at a decade’s high clip.
Builder confidence fell slowly in the beginning of the year, before dropping off more dramatically in May and continuing to fall all the way to an index of 31 in December 2022, the lowest level since June 2012, down from the pandemic high of 90 in November 2020, and down from 84 in December 2021. As construction activity slowed, household formations continued to climb, reaching the highest number of total households in US history in December 2022 with over 2 million new households added in the course of a year.
 [2]
[2]
Highlights:
- US housing markets continue to struggle with a sizable shortage of new homes, a result of more than a decade of under-building relative to population growth.
- In 2022, the U.S. saw 2.06 million household formations, resulting in 15.6 million household formations between 2012 and 2022. In this time period, 13.3 million housing units were started, and 11.9 million were completed.
- The total housing starts count includes 9.03 million single-family and 4.2 million multi-family homes. Housing completions include 8.5 million single-family homes and 3.4 million multi-family homes.
- The gap between single-family home constructions and household formations grew to 6.5 million homes between 2012 and 2022. However, including multi-family home construction reduces this gap to 2.3 million homes.
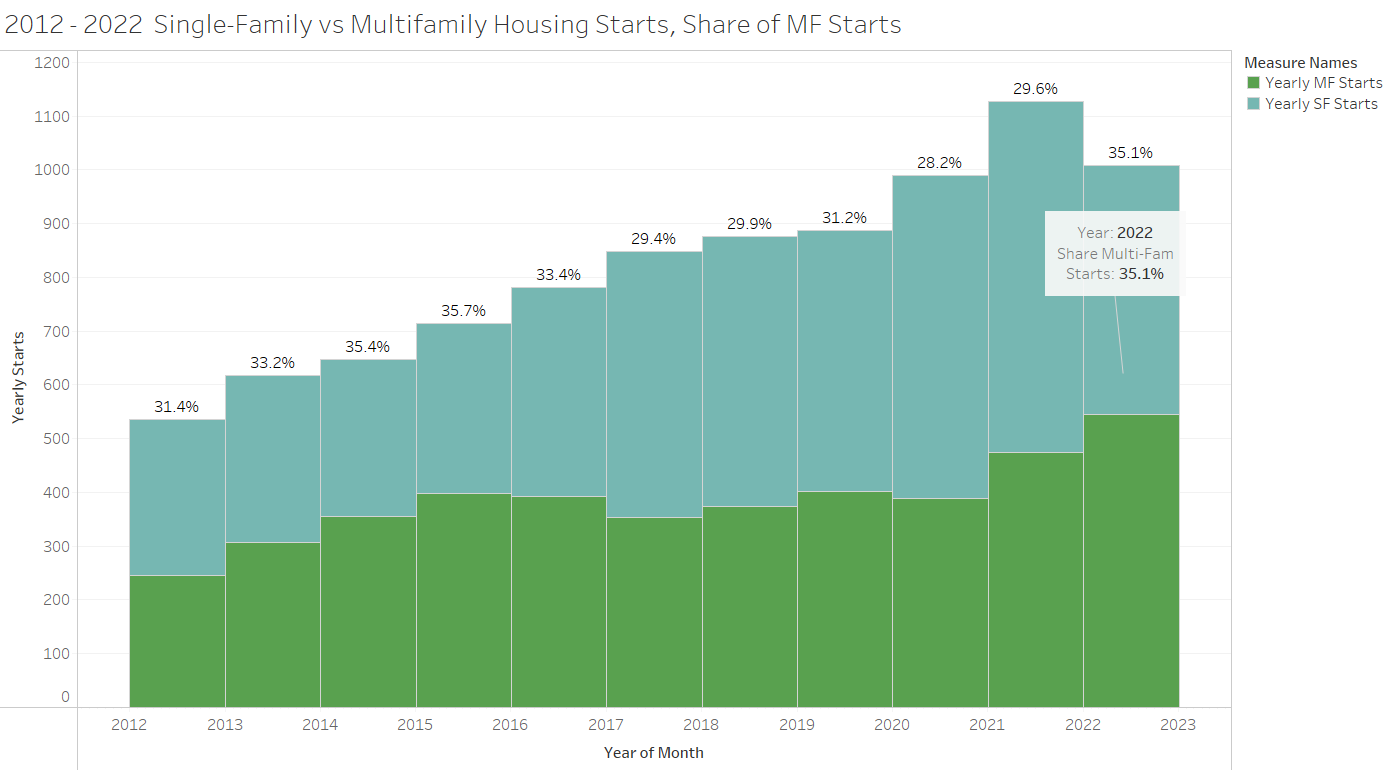
- Multi-family home construction picked up in 2022, reaching 35.1% of all housing starts by the end of the year, a level not seen since 2015.
- The rate of overall housing starts slowed in 2022 while completions climbed.
- In 2022, roughly 1.0 million single-family homes were started, which is 10.6% fewer than in 2021, though still more than in any other single year back to 2012.
- Multi-family home starts picked up, reaching 545,500, up 15.0% compared to 2021, and up 47.8% compared to the 2012-2021 average.
- In 2022, 1.4 million housing units were completed (+3.8% YY), including 1.02 million single-family units (+5.4% YY) and 370,700 multi-family units (-0.2% YY). The overall number of home completions and the rate of single-family home completion were both the highest in the last 10 years.
- Builders’ sentiment dwindled in 2022, reaching the lowest level since April 2020. Sentiment improved slightly in January 2023 as mortgage rates dropped, though the index remained near recent lows.
- New home affordability continues to drop rapidly with just 10% of new homes sold for less than $300,000 in Q4 of 2022, down from 41% in the fourth quarter of 2019.
Single-family housing starts fell in tandem with builder confidence, and in response, builders pivoted towards multi-family housing as the rental market remained profitable with nationwide rent hitting a new all-time high [3]. Housing construction of buildings with 2-or-more units was 29.6% of all housing starts in 2021 and grew to 35.1% by the end of 2022. The fruits of this pivot will pan out over the next year as the typical multi-family home takes 15 months to complete, whereas a single-family home takes closer to 7 months. In January 2023, for example, even as multi-family housing starts slowed, a record high of 932,000 multi-family housing units were under construction. Multi-family housing can help with ongoing housing affordability issues by providing more supply for renters.
Despite Multi-Family Construction, the Housing Supply Gap Widens
In 2022, an additional 2.06 million households formed, resulting in a total of 15.6 million new households between 2012 and 2022. Homebuilders started construction on about 1 million single-family homes and 546,000 multi-family homes in 2022, bringing the 2012 to 2022 overall housing starts total to 13.3 million homes, 903,000 of which were single-family. As household formations outpaced housing starts in 2022, the gap between total housing starts and household formations widened from 1.8 million housing units between 2012 and 2021 to 2.3 million units at the end of 2022. The gap between single-family housing starts and household formations grew from 5.5 million at the end of 2021 to 6.5 million at the end of 2022 as household formations picked up significant steam and single-family home construction waned.
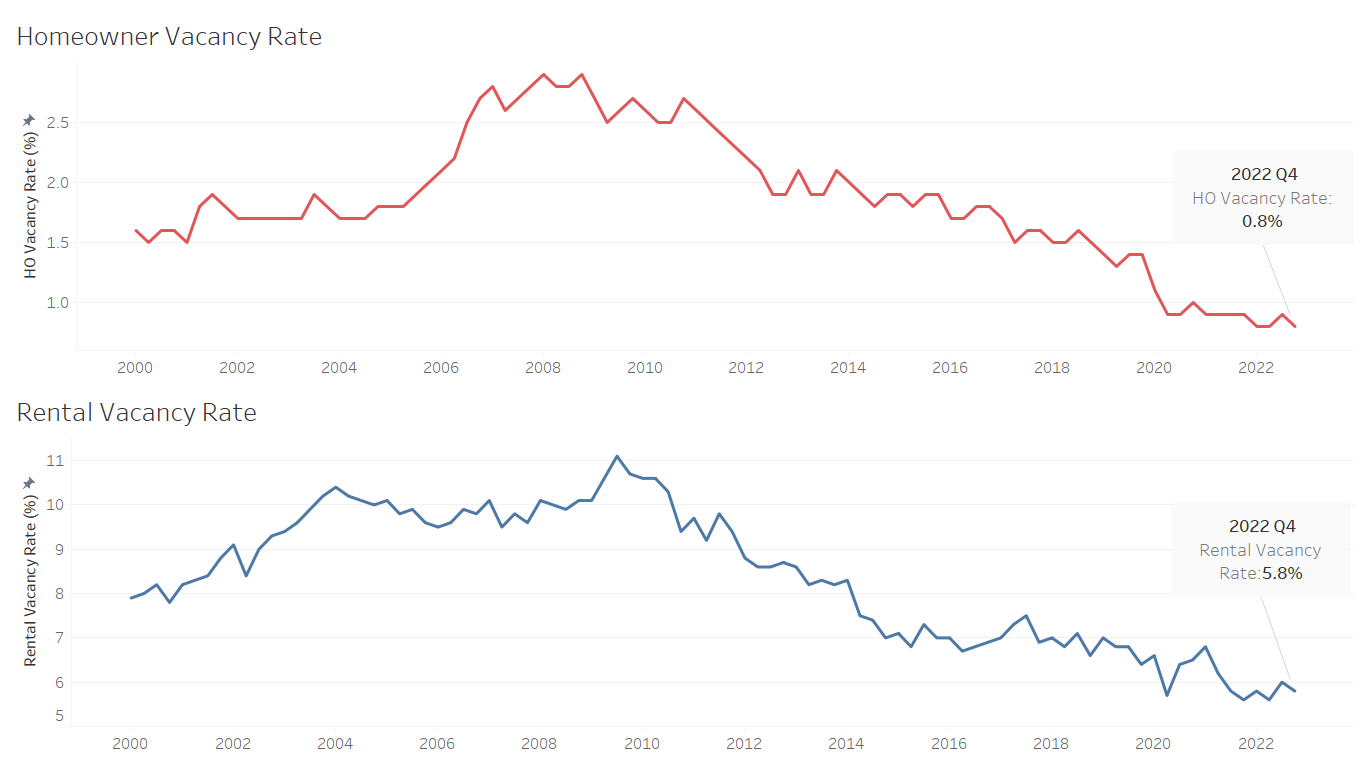
This trend of underbuilding relative to household formation carries over to homeowner vacancy rates as well as rental vacancy rates. As households form and housing starts fail to keep pace, the number of homes sitting empty falls. Homeowner vacancy dropped from 2% in 2012 to 0.8% by the end of 2022. Similarly, rental vacancy rates plummeted, reaching a low 5.6% in the 2021 Q4 and again in 2022 Q2 before rising slightly to 5.8% in 2022 Q4.
 [4]
[4]
Between 2012 and 2022, the average rate of household formation was 1.4 million households per year, while the average rate of housing starts was 1.2 million homes (including both single-family and multi-family) per year. Housing starts climbed each year between 2012 and 2021, reaching 1.64 million in 2021 before falling slightly in 2022 to a year’s end figure of 1.55 million. Multi-family properties comprised, on average, 31.8% of housing starts between 2012 and 2021, before growing significantly to 35.1% in 2022 as mortgage rates and prices led to a pullback in demand for single-family homes, opening up the opportunity for more building in the multi-family market, dominated by rentals. Through the first three quarters of 2022, an average 94.5% of all multi-family units started were intended to be used as rentals.
 [5]
[5]
Homebuilder Sentiment Falls in 2022 as Buyer Demand Wavers
In the 2010-2021 time period, home builder sentiment climbed. In 2010, confidence was still recovering from the housing crash, but the next decade marked a period of confidence-boosting expansion. Even the disruption of the pandemic served to ultimately boost builder confidence to new all-time highs, and to maintain it above pre-pandemic levels after the initial shock wore off. After homebuilder sentiment hit the lowest levels since 2012 in April 2020, it has been on a relatively steady upward trend, reaching an all-time high of 90 in November 2020. In 2021, homebuilder sentiment averaged 81, the highest average yearly sentiment on record, up 11 points from 2020.
However, as mortgage rates climbed in early 2022, homebuilder sentiment began to fall. By December 2022, homebuilder sentiment had fallen to 31 from 83 in January, its lowest level since the early months of the pandemic, and before that, since June 2012. Homebuilders have become more cautious in the face of rising unaffordability. The slowdown in single-family housing starts reflects homebuilders’ concern with single-family home demand. While the sizable housing gap continues to grow, homebuilders have pulled back on single-family construction as many would-be buyers cannot afford to buy a home given the current cost of financing. Instead, builders have transitioned their focus to the multi-family construction market, which will supply ample rental housing.
 [6]
[6]
What Would it Take to Close the Gap?
In 2022, the US saw the highest level of yearly household formations in the last decade with 2.06 million new households. The year’s pickup in household formation combined with the slow down in housing starts mean that if building and household formations continue at this clip, the gap between these metrics would never close. While 2021 boasted a best-in-5-year 0.98 home start:household formation ratio, this fell to 0.75 in 2022, worsening the total housing supply gap as well as the single-family home supply gap.
The single-family housing supply gap reached 6.5 million homes by the end of 2022. However, this figure overstates the housing shortage, as new multi-family homes offer options to buyers and renters. However, though multifamily housing is poised to offer more inventory, taking some pressure off of home and rental prices, these homes take an average of 15 months to complete. Therefore, the impact of these housing starts won’t be fully realized until late 2023 and into 2024.
If only single-family homes are considered, the rate of housing starts would need to triple to keep up with demand and close the existing 6.5 million home gap in 3 to 4 years. However, if the rate of total (multi- & single-family) housing starts increased by 50% from the 2022 rate to an average rate of 2.3 million housing starts per year, a pace of construction on par with what we saw in the early 1970s and some of the peak months for building in the mid-2000s, it would take between 2 and 3 years to close the existing 2.3 million home gap, assuming the 2012 – 2019 average rate of household formations (~1.3 million households per year). Closing the total housing gap would mean an increase in both single and multi-family supply would help return balance to the housing market by taking pressure off of both sale and rent prices.
2022 Home Completions Outpace Previous Years
Housing completions reached the highest rate in the last 10 years, due to the completion of the sizable uptick in single-family homes started in 2021 and early 2022. As mortgage rates and high prices caught up to buyers, single-family housing demand waned and homebuilders pivoted to multi-family housing starts through late 2022. The housing completion data will show the pivot to multi-family homes in the coming months and years as multi-family homes take an average 15 months to complete versus 7 months [7] for single-family homes.
 [8]
[8]
The spillover effect of the uptick in single-family housing starts in 2021 and into early 2022 drove the high number of homes completed through 2022. The number of housing starts per completion grew significantly between 2019 and 2021, then slowed in 2022 as completions kept pace and housing starts slowed. The pickup in home completions and the slowdown in starts narrowed the gap between the metrics, but considering the still-increasing housing supply gap, many buyers may continue to struggle to find suitable home options.
Affordable For-Sale Inventory Continues to Fall
New residential construction data shows that a rapidly decreasing proportion of new homes are affordable (less than $300,000 sales price). In 2019 Q4, 41% of new homes constructed were sold for less than $300,000. In 2020, this proportion dropped to 31%, and in 2021, only 14% of homes constructed were sold for less than $300,000. By Q4 of 2022, just 10% of new homes sold were priced under $300,000 and only 37% of new homes sold were priced under $400,000 (down from 66% in 2019). Rapid price growth over the last few years coupled with rapid mortgage rate growth in 2022 means buyers today are paying significantly more in home payments than in years past. Higher rates and home prices have increased the monthly cost of financing 80% of the typical home by nearly $650 (+49.6%) compared to a year ago in January 2023. This far outpaces recent rent growth (+3.2%) and inflation (+6.5%) and is a factor behind the recent finding that renting costs less than buying a starter-home in 45 of the 50 largest housing markets [9]. This affordability crisis has pushed many would-be homebuyers out of the market altogether.
To read the full report, including more data, charts and methodology, click here [1].