


 While national home prices did increase in May 2023, the rate at which it grew was the lowest on record since 2016.
According to the Monthly Housing Trends Report, published by Realtor.com, found that May’s home price growth slowed to 0.9% year-over-year as active inventory decreased in 21 out of the 50 largest metropolitan areas. In addition, home inventory growth continues to slow—and is in fact still declining—in many metropolitan areas across the country as the lock-in effect keeps potential sellers in their homes leaving buyers to compete over the remaining affordable homes for sale.
"April and May are historically popular months to buy, and typically by this time in the year we've exceeded the prior year's peak home price. Weakening home price growth for the past 12 months is increasing the odds that we may not see a new home price peak this year, for the first time in the history of our listing data, which dates back to mid-2016, and this is likely welcome news to homeshoppers," said Danielle Hale, Chief Economist for Realtor.com. "Despite stalling price growth, home listing prices are up slightly compared to last May, and with rates more than a percentage point higher than a year ago, buyers continue to face affordability headwinds. The good news for sellers is that buyers are still out there, and this month's slower growth in the active inventory of homes for sale indicates that shoppers are in the market and actively searching for homes that fit their needs and budget."
So what does this mean for buyers, sellers, and the market in general? A slower housing market means buyers in some areas may find they can once again have an offer accepted when putting less down, as Realtor.com found down payments declined for the first time since the COVID-19 pandemic torched the housing market. This suggests that it’s getting harder for buyers to keep up with costs and that a less competitive market may be giving buyers an opportunity to secure a home with a smaller down payment.
"As buyers' budgets are being stretched to the max, there are opportunities for negotiation, especially on homes that have been sitting on the market for a while," said Realtor.com Executive News Editor Clare Trapasso. "They can ask sellers to come down on the price, make costly repairs, as well as contribute to their closing costs or buy down their mortgage rates. If they're purchasing new construction, they can also request upgrades. This can add up to substantial savings."
Additionally, home listing prices were slightly higher in May year-over-year, but the growth in typical asking price of for-sale homes continued to decline into the low single digits. Despite this trend, home sellers continue to have high expectations of the housing market and buyers, in some cases, too high. The number of homes with price reductions—a sign that a seller needed to adjust pricing to attract a buyer—was higher than year ago levels but in line with pre-pandemic years.
Other key information from the report, as highlighted by Realtor.com, includes:
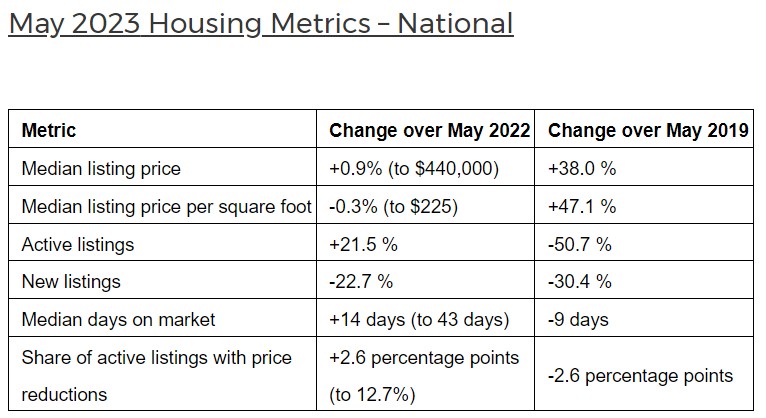
- The U.S. median list price grew to $441,000 in May, up from $430,000 in April, and down -1.7% from June 2022's record high of $449,000. The annual growth rate slowed to +0.9% in May, down from April's 2.5% growth rate, to the lowest price growth on record since 2016.
- Nationally, the median listing price per square foot declined (-0.3%) compared to the previous year for the first time in our data history since 2016.
- Higher mortgage rates and home prices compared to May of last year increased the monthly cost of financing 80% of the typical home by roughly $296 (+15.5%) compared to a year ago.
- Among the 50 largest U.S. metros, 15 out of the largest 50 markets saw their median list price decline. The greatest price declines were seen in Texas metros: Austin (-7.3% year over year), Houston (-5.9%), and San Antonio (-5.8%).
- Nationally, 12.7% of active listings had their price reduced in May, up from 10.2% in May of last year. While higher than last year, the rate is below typical 2017-2019 levels. Large southern metros saw the largest increase in the percentage of homes with price reductions, led by Austin, Texas (+11.9 percentage points year over year), San Antonio, Texas (+9.1 percentage points) and Oklahoma City, Oklahoma (+8.7 percentage points).
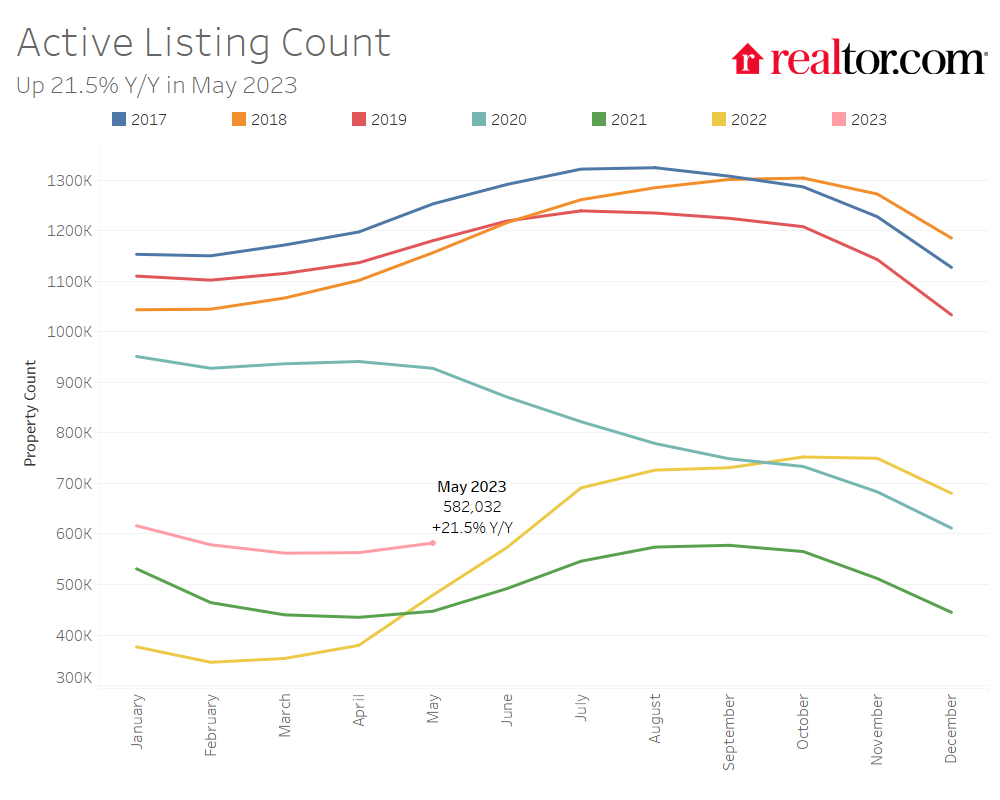
- Nationally, the number of active listings grew 21.5% year over year in May; however, the inventory growth rate continued to slow for the third month in a row. Both newly listed homes (-22.7%) and homes under contract (-18.1%), or pending listings, declined year over year.
- Compared to last year, active inventory decreased in 21 out of 50 of the largest metros. Markets that reported large yearly declines included San Jose, California (-35.3%); Sacramento, California (-27.3%); and Hartford, Connecticut (-26.0%).
- Among the 50 largest metros, active inventory increased 20.8% over last year, driven exclusively by Southern metros, such as Nashville, Tennessee (+124.7%); Austin, Texas (+112.5%), and San Antonio, Texas (+93.4%). Despite high inventory growth compared to last year, most Southern metros still had lower inventory levels compared to pre-pandemic years.
- On average across the 50 largest metros, no region or metro area saw year-over-year increases in new listings in May. The South saw new listing activity decline the least (-20.4%) compared to the previous year, while they fell 32.9% in the West, 22.9% in the Northeast, and 22.8% in the Midwest.
- In May, the typical home spent 43 days on market, 14 days longer than this time last year, but 9 days faster than the pre-pandemic May 2017-2019 average.
- Across the 50 largest U.S. metros, the typical home spent 37 days on the market, 13 days more than the previous May. This trend was seen across all regions, with larger metros in the South seeing the greatest increase (+16 days), followed by the West (+12 days), Midwest (+9 days) and Northeast (+7 days).
- All of the 50 largest metros saw an increase in time on market compared to the previous year. Time on market increased the most in Raleigh, North Carolina (+31 days); Austin, Texas (+28 days); and Miami, Florida (+27 days).
Click here to view the report in its entirety, including breakdowns for some of the top-performing metropolitan areas across the country.


