


In 2020, with the onset of the COVID-19 pandemic, a large and rapidly growing share of renters were cost-burdened, according to a Center analysis of new experimental data from the American Community Survey (ACS).
With commentary by Senior Research Associate Whitney Airgood-Obrycki, and Senior Research Analyst Alexander Hermann, ACS has examined recent research, trends and housing perspectives surrounding homeownership, along with the significant racial and financial divide between buyers during the Coronavirus pandemic.
From 2019 to 2020, the share of renter households with cost burdens rose nearly 3 percentage points. Among renters, the pandemic widened socioeconomic and racial inequalities in housing cost burdens.
In a previous blog, it was noted that the 2020 ACS suffered from data collection issues due to the pandemic, which resulted in nonresponse bias the Census Bureau couldn’t fully account for with their typical weighting methodology. The Census released experimental data for 2020 with new weights, though these data are essentially incomparable to previous years.
Cost-burdened renters spend more than 30% of their incomes on rent and utilities each month. In 2020, the share of burdened renters reached 46%, up a full 2.6 percentage points from the year before. Pandemic job losses that hit renters especially hard widened the affordability gap between owners and renters. Owner cost burden rates rose just 1.0 percentage point in 2020, increasing the gap in cost burdens between owners and renters to nearly 25 percentage points.
Before the pandemic, cost burdens were highest for lower-income renter households and rising fastest among middle-income renters. This trend continued in the first year of the pandemic. Cost burdens increased by nearly 5 percentage points, to 80%, for households making less than $30,000.
Renters making $30,000–45,000 saw their cost burden rate jump by an astounding 9 percentage points to 58%, while those making $45,000–75,000 posted rates of 30%, a 5-percentage-point rise from 2019. Higher-income households maintained a relatively low burden rate of 8%, less than 2 percentage points above 2019 levels.
Key Findings
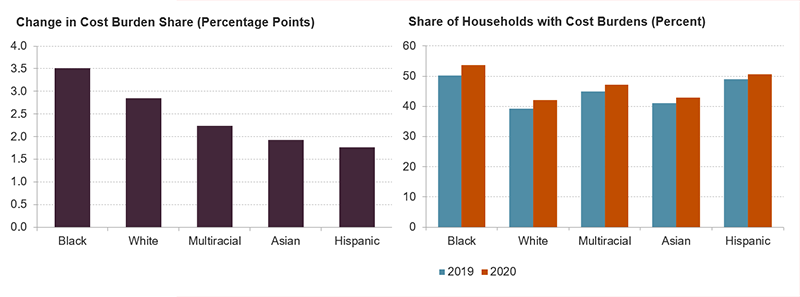
The Black-White Affordability Gap Widened For Renters
The figure shows the percentage point increase in cost burden shares by race/ethnicity of the householder and the cost burden rates by race/ethnicity for 2019 and 2020. Households headed by a Black person had the largest increase in cost burden rates at about 3.5 percentage points while Asian and Hispanic households had the lowest increases. With these increases, more than half of Black- and Hispanic-headed renter households are cost burdened. White-headed households continued to have the lowest rate at just over 40%.
Across age categories, cost burden rates increased most rapidly for renter households headed by someone age 65 or older with a rise of 5 percentage points. Older adult household incomes rose slower compared to other age groups. This may be due, in part, to the high share of older adult households that rely heavily on social security income. In 2020, the cost-of-living increase for social security was just 1.3 percent while median rents for older adults rose much faster.
These rent increases put the older adult cost burden rate at 55% in 2020. Only the youngest renter households headed by someone under age 25 had higher cost burden shares at 58%, following a 4-percentage point increase in 2020.
Middle-Income Renters’ Cost Burdens Soared in 2020
The figure shows the percentage point increase in cost burden shares by income and the cost burden rates by income for 2019 and 2020. Households making between $30,000 and $45,000 had by far the largest increase in cost burden rates at about 9 percentage points. Despite this increase, households making less than $30,000 continue to have the highest cost burden rate at a whopping 80%.
Notes: Moderately (severely) cost-burdened households pay more than 30% up to 50% (more than 50%) of household income for housing. Households with zero or negative income are assumed to be severely burdened, while households paying no cash rent are assumed to be unburdened. Household incomes are inflated to 2020 dollars using CPI-U All Items, according to JCHS tabulations of US Census Bureau, 2019 & 2020 Experimental American Community Survey 1-Year Estimates.
Cost burdens rose fastest among renter households headed by a Black person, widening the existing Black-white affordability gap. Cost burden rates increased 3.5 percentage points for Black renter households, reaching 51% in 2020.
White households also saw their cost burden share increase rapidly by nearly 3 percentage points, but these renters continued to have the lowest burden rates at 42%. Meanwhile, Asian-, Hispanic-, and multiracial-headed renter households fared only slightly better with about a 2-percentage point increase in their burden rates.
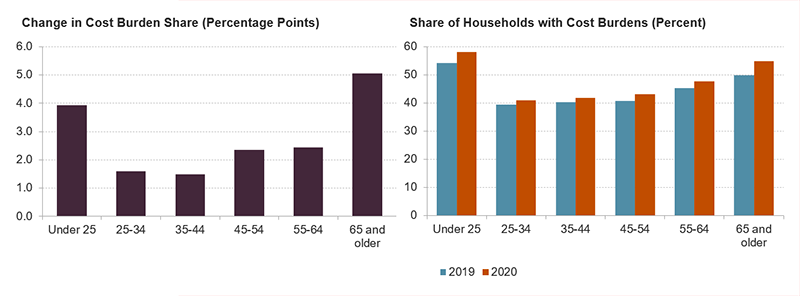
Older Adult Renters Had the Fastest Cost Burden Increases
The figure shows the percentage point increase in cost burden shares by age of the householder and the cost burden rates by age for 2019 and 2020. Households headed by an older adult had the largest increase in cost burden rates at about 5 percentage points. Households headed by someone aged 25-34 or 35-44 had the lowest rate of increase at about 1.5 percentage points. The increase for older adults pushed their cost burden rate above 50 percent. Meanwhile, younger households headed by someone under age 25 had the highest cost burden rate, reaching 58% in 2020.
Single-person renter households experienced the largest jump in cost burdens of all household types at 5 percentage points, likely related to the fact that older adults make up nearly a third of these households. It’s also possible that having only one earner meant that single-person households were less able to cope with rising rents and employment income losses in the first year of the pandemic. Interestingly, single parent renters, who have the highest burden rate at 58% and who may have been most likely to lose employment income due to childcare disruptions, saw their burden rates rise by just under 2 percentage points.
Cost Burdens Rose Quickly for Single-Person Renter Households
The figure shows the percentage point increase in cost burden shares by household type and the cost burden rates by household type for 2019 and 2020. Single-person renter households had the largest increase in cost burden rates at about 5 percentage points. Married households with children had the lowest rate of increase at less than 0.5 percentage points. Single parent households continued to have the highest cost burden rate at nearly 60% while the increase among single-person households pushed their rate up to 56%.
The experimental ACS data show that widening affordability gaps by income, race, and household type in the first year of the pandemic compounded existing inequities. Income supplements through expanded unemployment insurance and stimulus checks likely helped offset worsening cost burdens for some. Meanwhile, the overall rise in already high renter cost burden rates is troubling, particularly among the lowest-income and Black renter households.
Further income supports and rental assistance will be needed to help renters cope with increasingly unaffordable housing, especially given the record-high rent growth and tight market conditions over the last year that was recently documented in the State of the Nation’s Housing 2022 here.
To read the full analysis, including more commentary, charts and methodology, click here.


