While Americans nationwide struggle with housing costs and affordability, annual single-family home rent growth eased for the 14th consecutive month in June, registering a 3.3% gain, which remains in close range of the pre-pandemic growth rate.
This is according to CoreLogic's latest Single-Family Rent Index (SFRI) [1], which analyzes single-family rent price changes nationally and across major metropolitan areas.
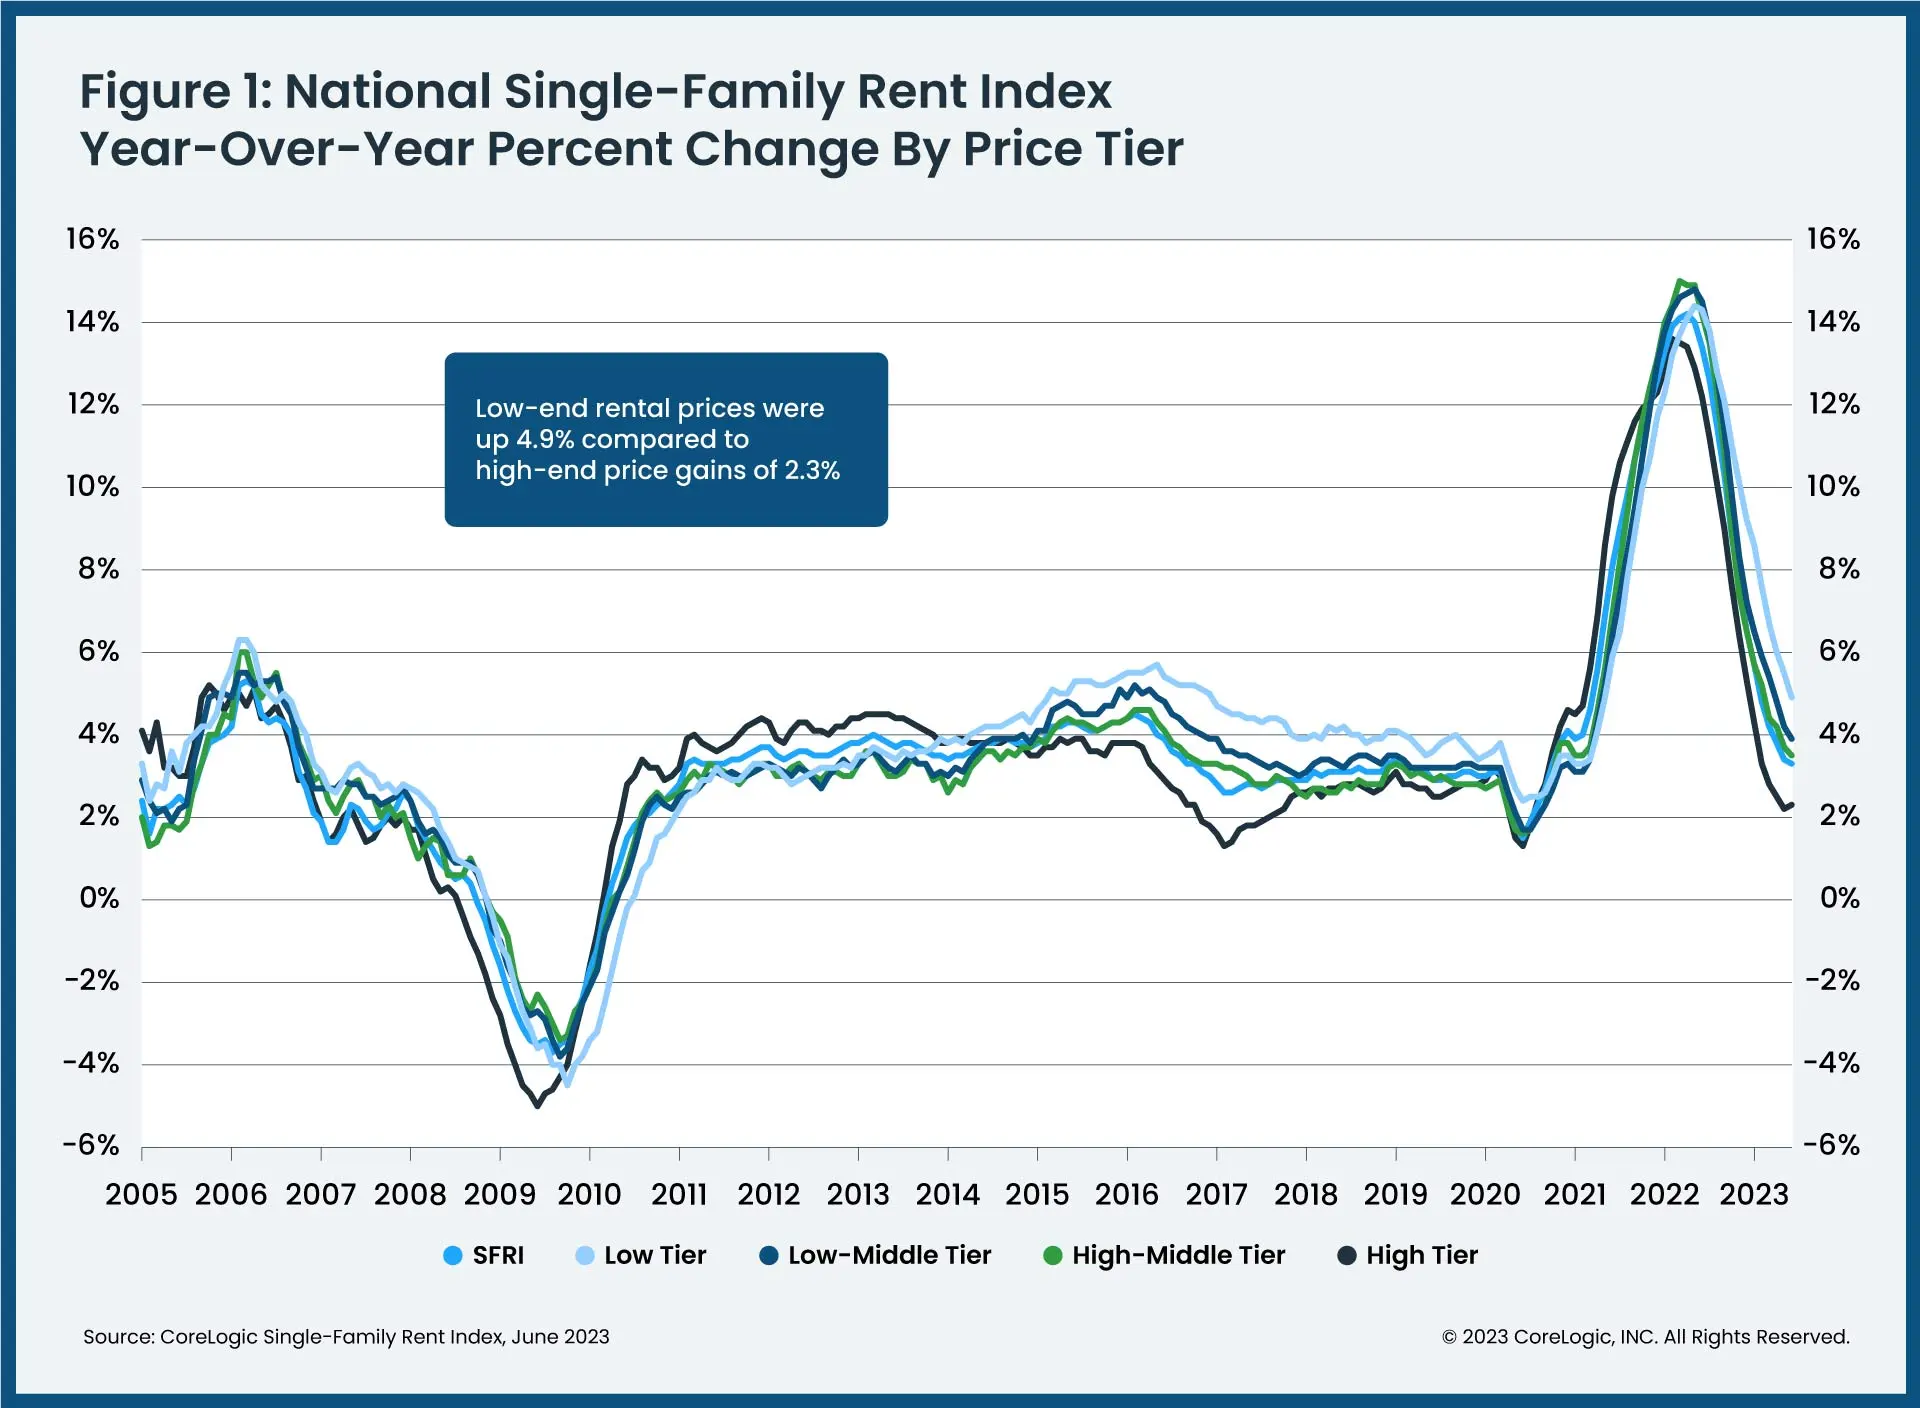
To gain a detailed view of single-family rental prices across different market segments, CoreLogic examines four tiers of rental prices and two property-type tiers. National single-family rent growth across those tiers, and the year-over-year changes, were as follows:
- Lower-priced (75% or less than the regional median): up 4.9%, down from 14.3% in June 2022.
- Lower-middle priced (75% to 100% of the regional median): up 3.9%, down from 14.5% in June 2022.
- Higher-middle priced (100% to 125% of the regional median): up 3.5%, down from 14.2% in June 2022.
- Higher-priced (125% or more than the regional median): up 2.3%, down from 12.2% in June 2022.
- Attached versus detached: Attached single-family rental prices grew by 4% year over year in June, compared with the 2.6% increase for detached rentals.
Lower-priced rentals continued to see more demand and thus greater annual gains than their higher-priced counterparts, a trend that is partially due to declining affordability, and one that has been increasingly exacerbated by inflation.
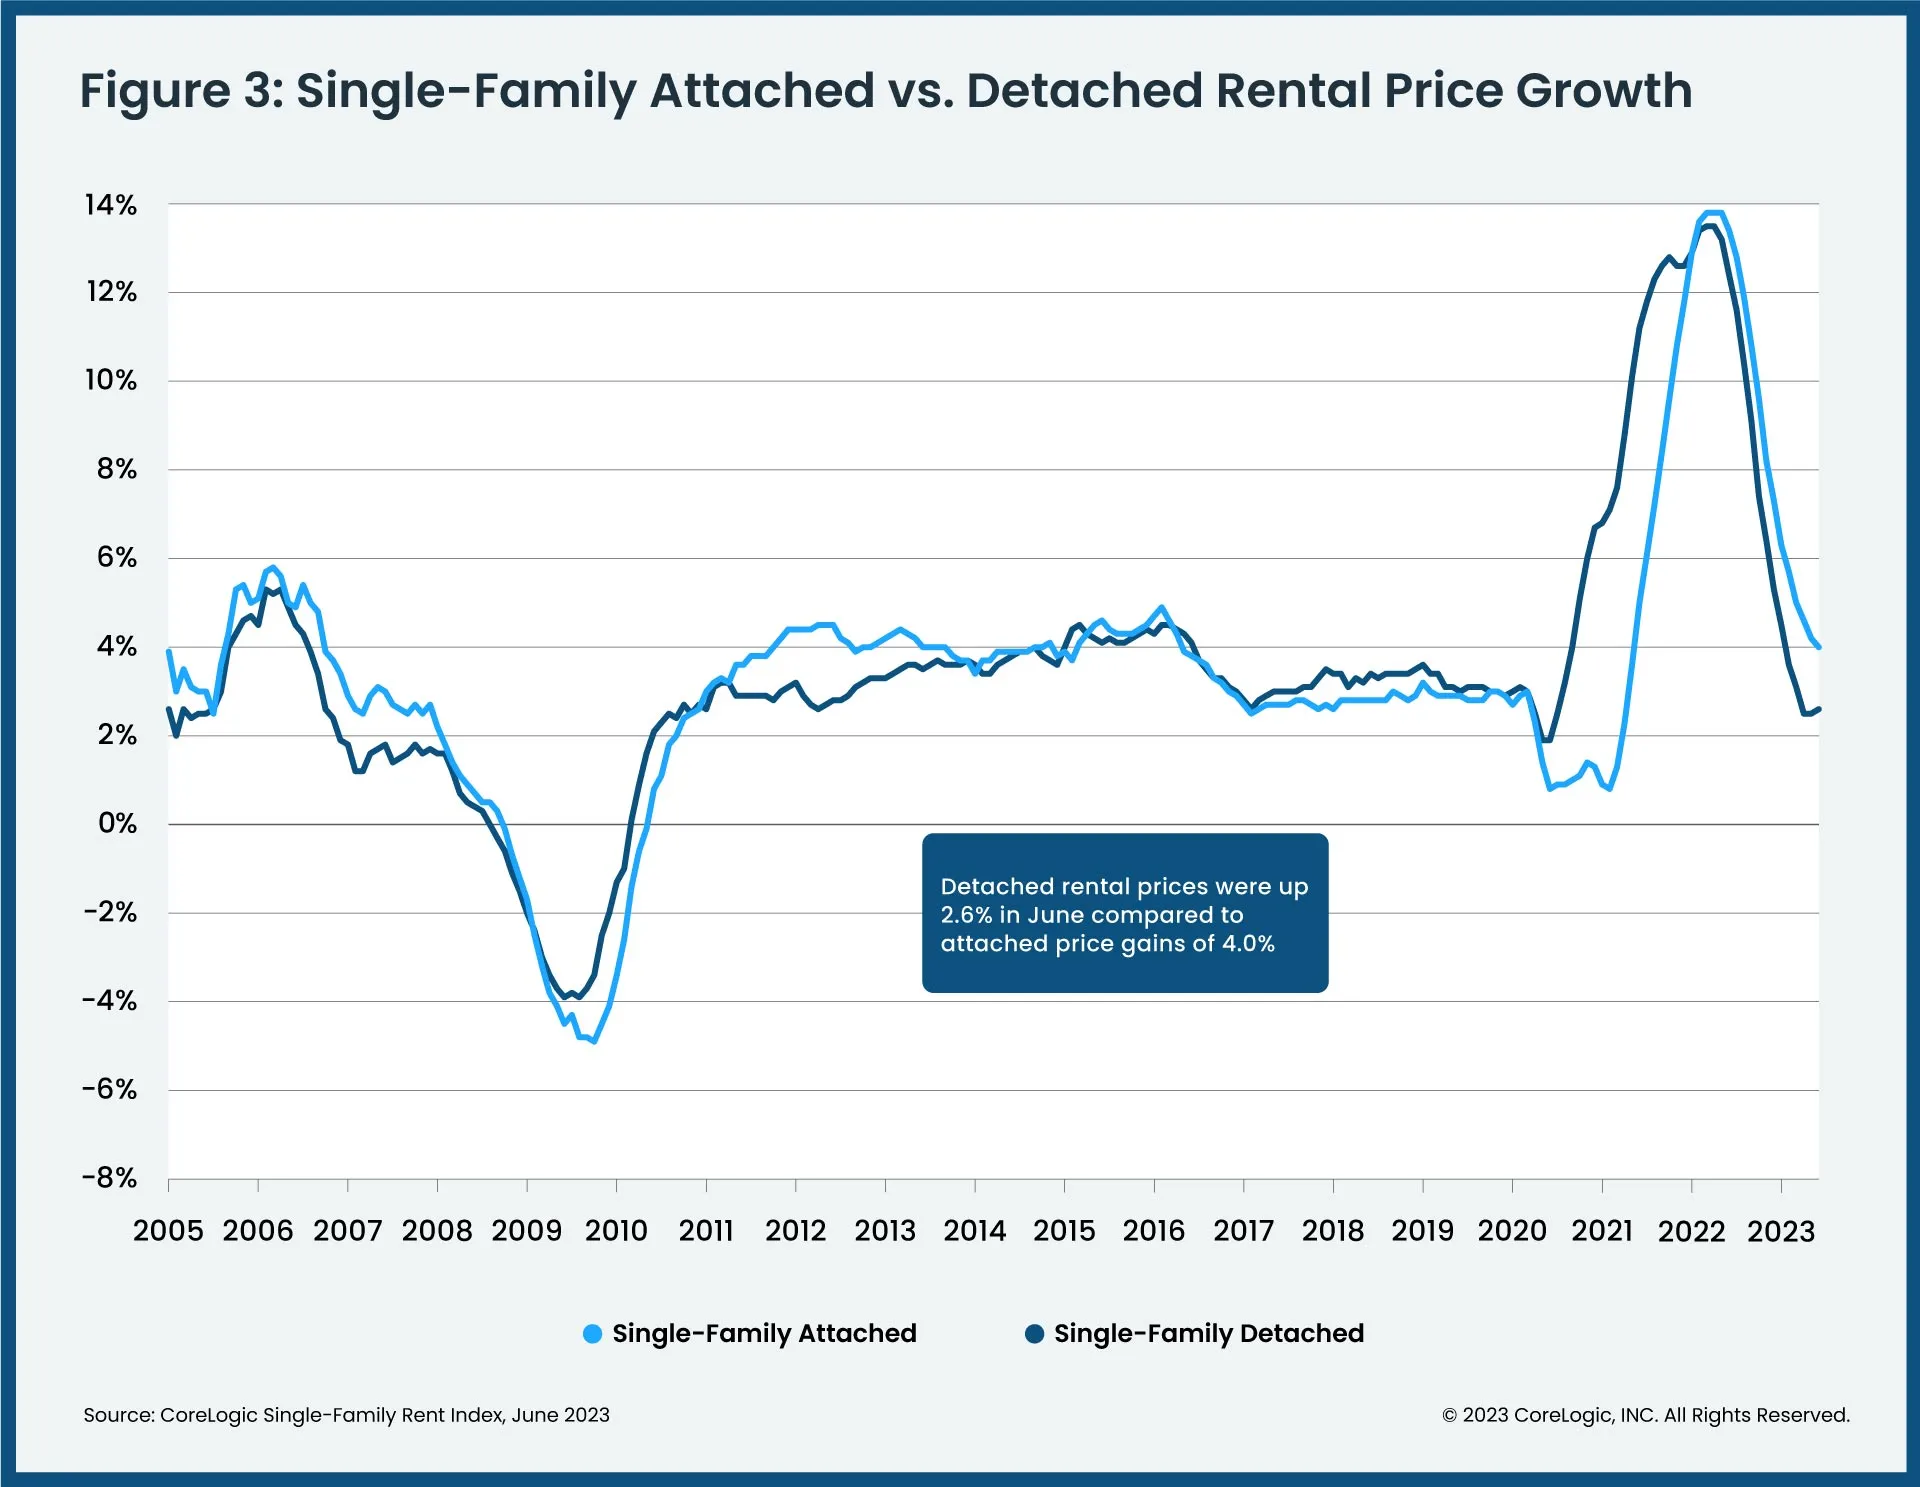
“Annual single-family rent growth has returned to its long-term, pre-pandemic rate, but increases for attached properties were one-and-a half-times that of detached properties in June; this is historically not the case, as both housing types tend to rise at the same pace,” said Molly Boesel, Principal Economist for CoreLogic. “However, while rent growth for attached properties lagged that of detached properties in 2020 and 2021, it has outpaced the latter in 2022 to 2023. Rent growth for attached homes is projected to continue to exceed that of detached properties as the market balances.”
Of the 20 metros analyzed, Chicago posted the highest year-over-year increase in single-family rents in June 2023, at 6.6%. Boston registered the second-highest annual gain at 5.9%, followed by Orlando, Florida, at 5.5%. Las Vegas also experienced an annual rent price decline of -1.2%.
The next CoreLogic Single-Family Rent Index will be released on September 19, 2023, featuring data for July 2023.
To read the full report, including more data, charts, and methodology, click here [2].