 According to a report published by HUD this year, approximately 1.57 million homes out of the 132.42 million homes that existed in 2011 disappeared from inventory.
Those 1.57 million homes represent approximately 1.2 percent of all homes that existed in the U.S. What happened to those homes?
The Components of Inventory Change: 2011-2013 report [1], based on the American Housing Survey [2] conducted in odd-numbered years by the Census Bureau and funded by HUD, found that out of those 1.57 million homes lost between 2011 and 2013:
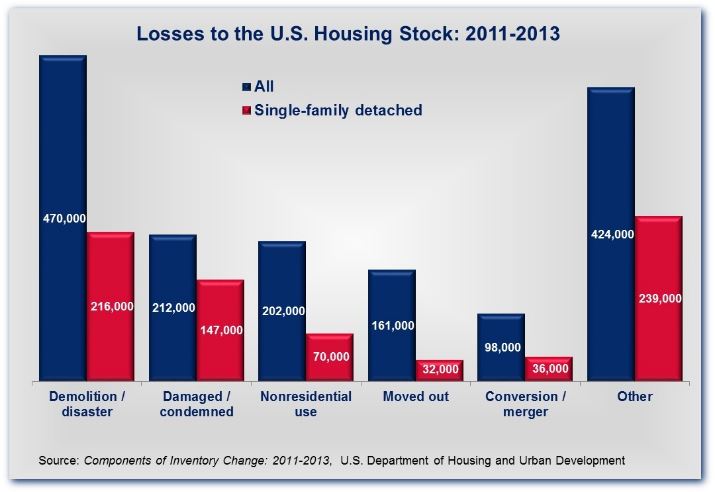
- 470,000 homes were lost because of demolitions or disasters;
- 212,000 homes became damaged or condemned;
- 202,000 existing homes were put to non-residential uses;
- 161,000 homes had been moved from where they were in 2011 (primarily manufactured or mobile homes);
- 98,000 homes were lost because of conversions or mergers;
- And 424,000 homes were lost due to undermined causes or for reasons that did not fit into one of the above categories.
 “These statistics imply that 0.59 percent of the housing units in the U.S. are lost in a given year, but there are differences depending on the type of structure,” said Paul Emrath, VP, Survey and Housing Policy Research with the National Association of Home Builders (NAHB) [3]. “Mobile homes, for example, are considerably more likely to be ‘lost’ (as they are obviously more susceptible to being moved out from their original locations).”
Single-family detached homes made up about 62 percent of the 132.42 million existing housing units in the United States in 2011 (about 82.97 million). Less than half of the homes lost between 2011 and 2013 (approximately 740,000) were of the detached single-family variety.
“In addition to units moved out of their old locations, certain types of losses like mergers and shifts to non-residential uses are particularly uncommon among single-family detached structures,” Emrath said.
The age of the home is also a factor; according to the HUD report, the loss rate on homes built in 1950 or later is around half of one percent. For homes built after 1950, the loss rate jumps to more than 1 percent.