Homebuyer affordability dropped in September, as the national median payment applied for by applicants increased 5.5% to $1,941 from $1,839 in August, according to the Mortgage Bankers Association's (MBA) Purchase Applications Payment Index [1] (PAPI).
“Homebuyer affordability took an enormous hit in September, with the 75-basis-point jump in mortgage rates leading to the typical homebuyer’s monthly payment rising $102 from August,” said Edward Seiler, MBA's Associate VP, Housing Economics, and Executive Director, Research Institute for Housing America. “With mortgage rates continuing to rise, the purchasing power of borrowers is shrinking. The median loan amount in September was $305,550–much lower than the February peak of $340,000.”
“MBA expects supply and affordability constraints and economic uncertainty to continue to hamper the purchase market," said Seiler. "Purchase origination volume is forecast to decrease 3.3% next year to $1.53 trillion.”
An increase in MBA’s PAPI–indicative of declining borrower affordability conditions–means that the mortgage payment to income ratio (PIR) is higher due to increasing application loan amounts, rising mortgage rates, or a decrease in earnings. A decrease in the PAPI–indicative of improving borrower affordability conditions that occurs when loan application amounts decrease, mortgage rates decrease, or earnings increase.
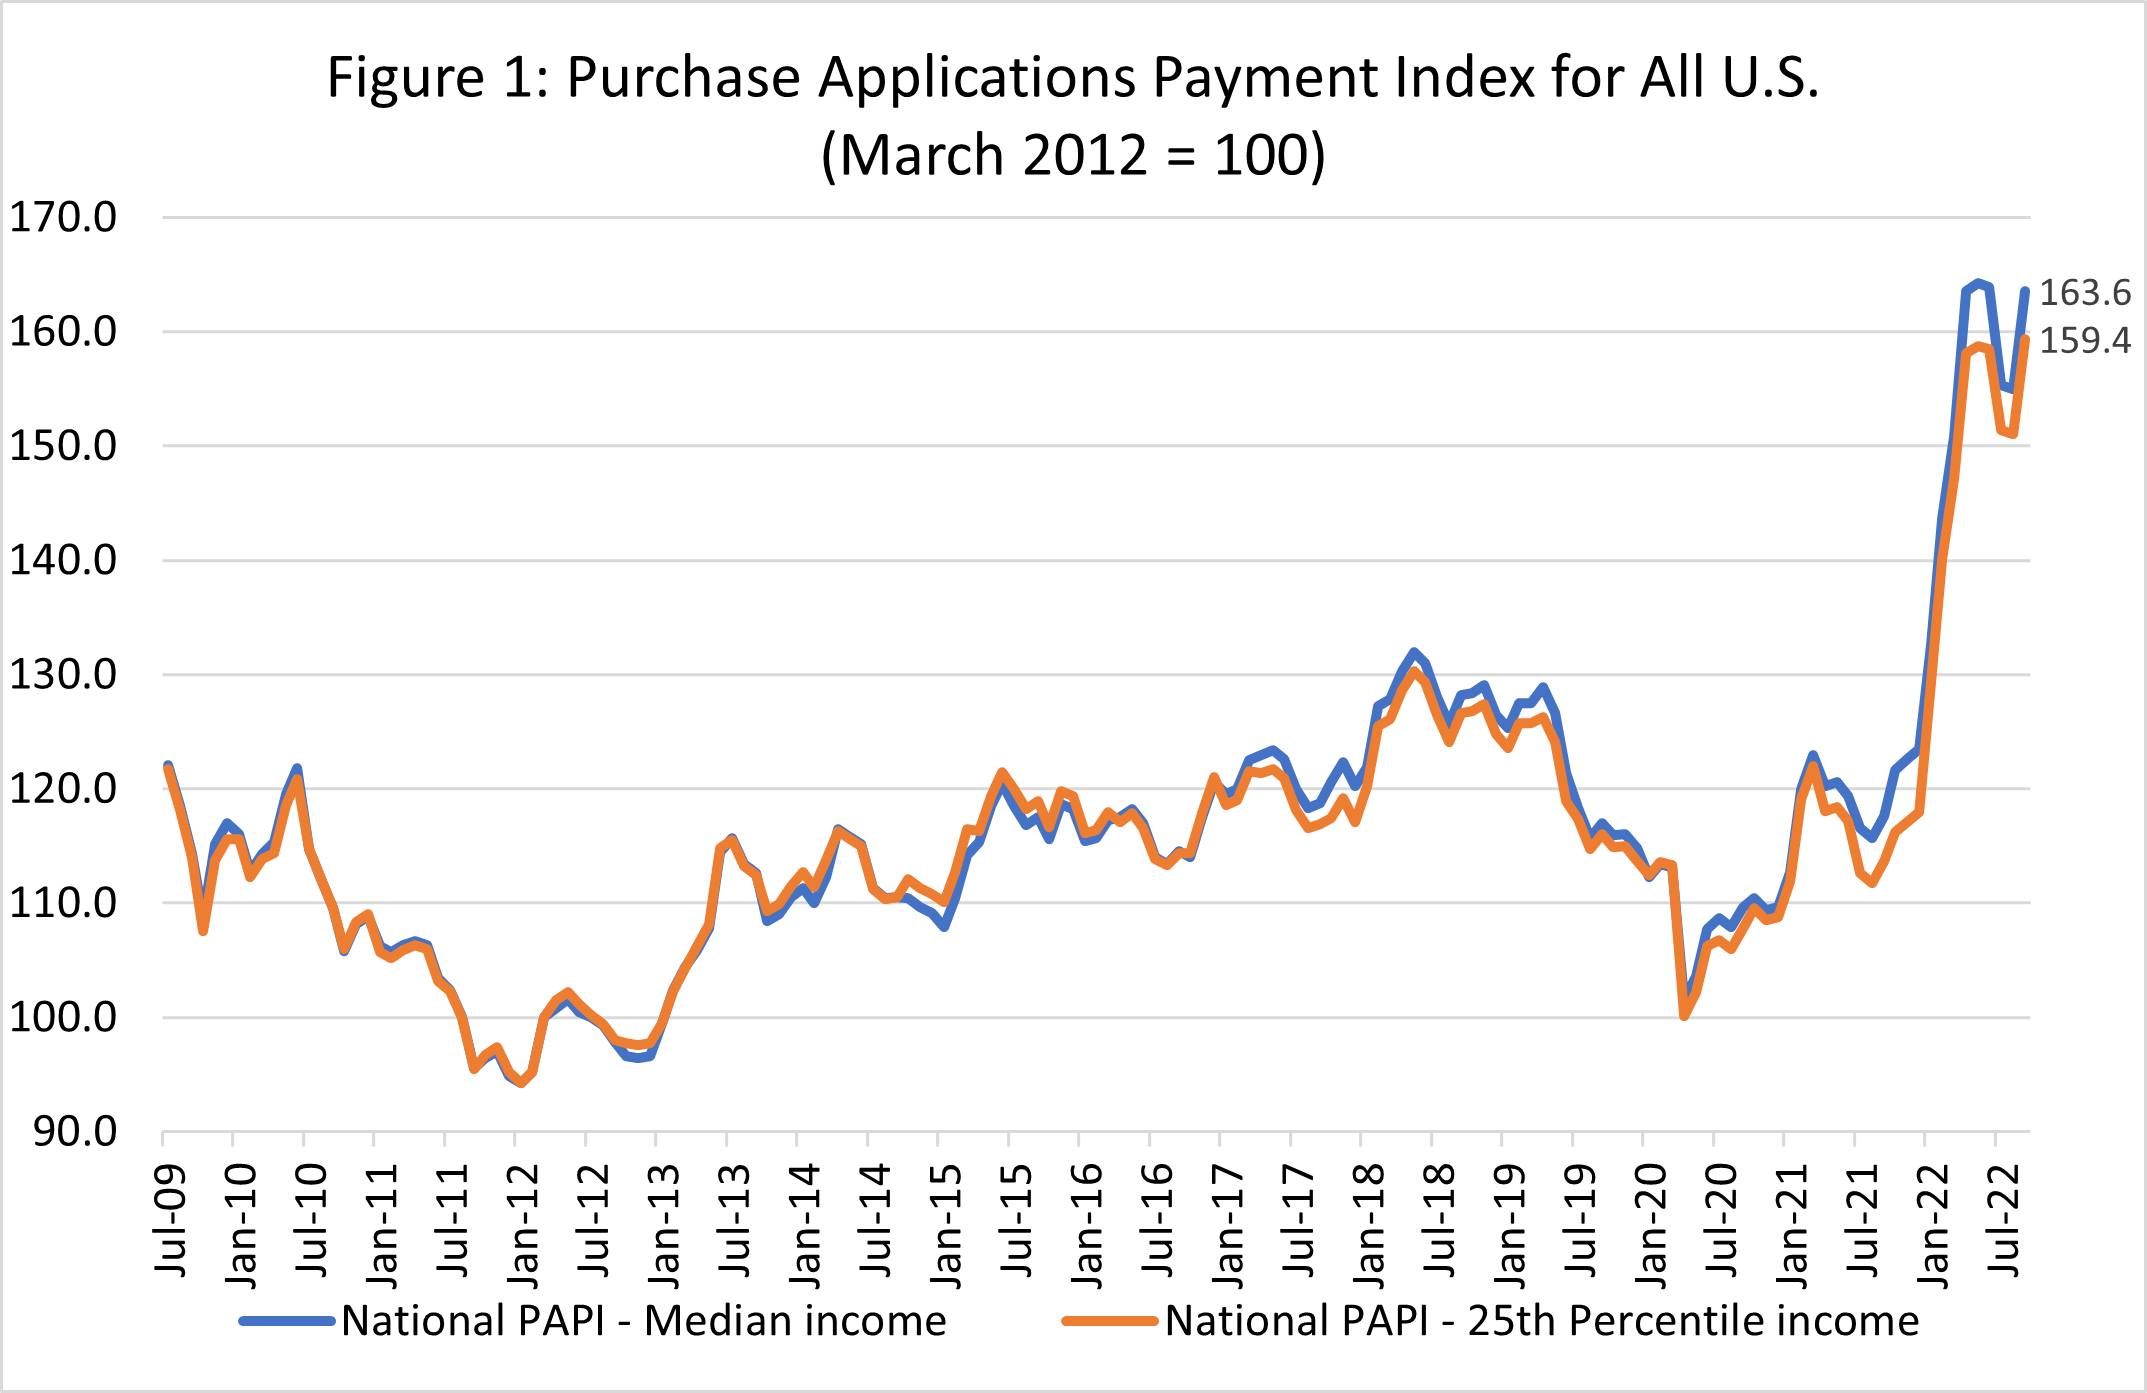
The national PAPI (Figure 1) increased 5.5% to 163.6 in September from 155.0 in August–this increase reverses four consecutive months of declines from a high of 164.2 in May 2022. Compared to September 2021 (117.6), the index has jumped 32.5% in the first nine months of 2022. For borrowers applying for lower-payment mortgages (the 25th percentile), the national mortgage payment increased to $1,271 in September from $1,210 in August.
Additional Key Findings of MBA's Purchase Applications Payment Index (PAPI) – September 2022
- The national median mortgage payment was $1,941 in September, up from $1,839 in August and from $1,844 in July. It is up by $558 in the first nine months of the year, equal to a 40.4% increase.
- The national median mortgage payment for FHA loan applicants was $1,566 in September, up from $1,469 in August and $1,022 in September 2021.
- The national median mortgage payment for conventional loan applicants was $2,003, up from $1,901 in August and $1,373 in September 2021.
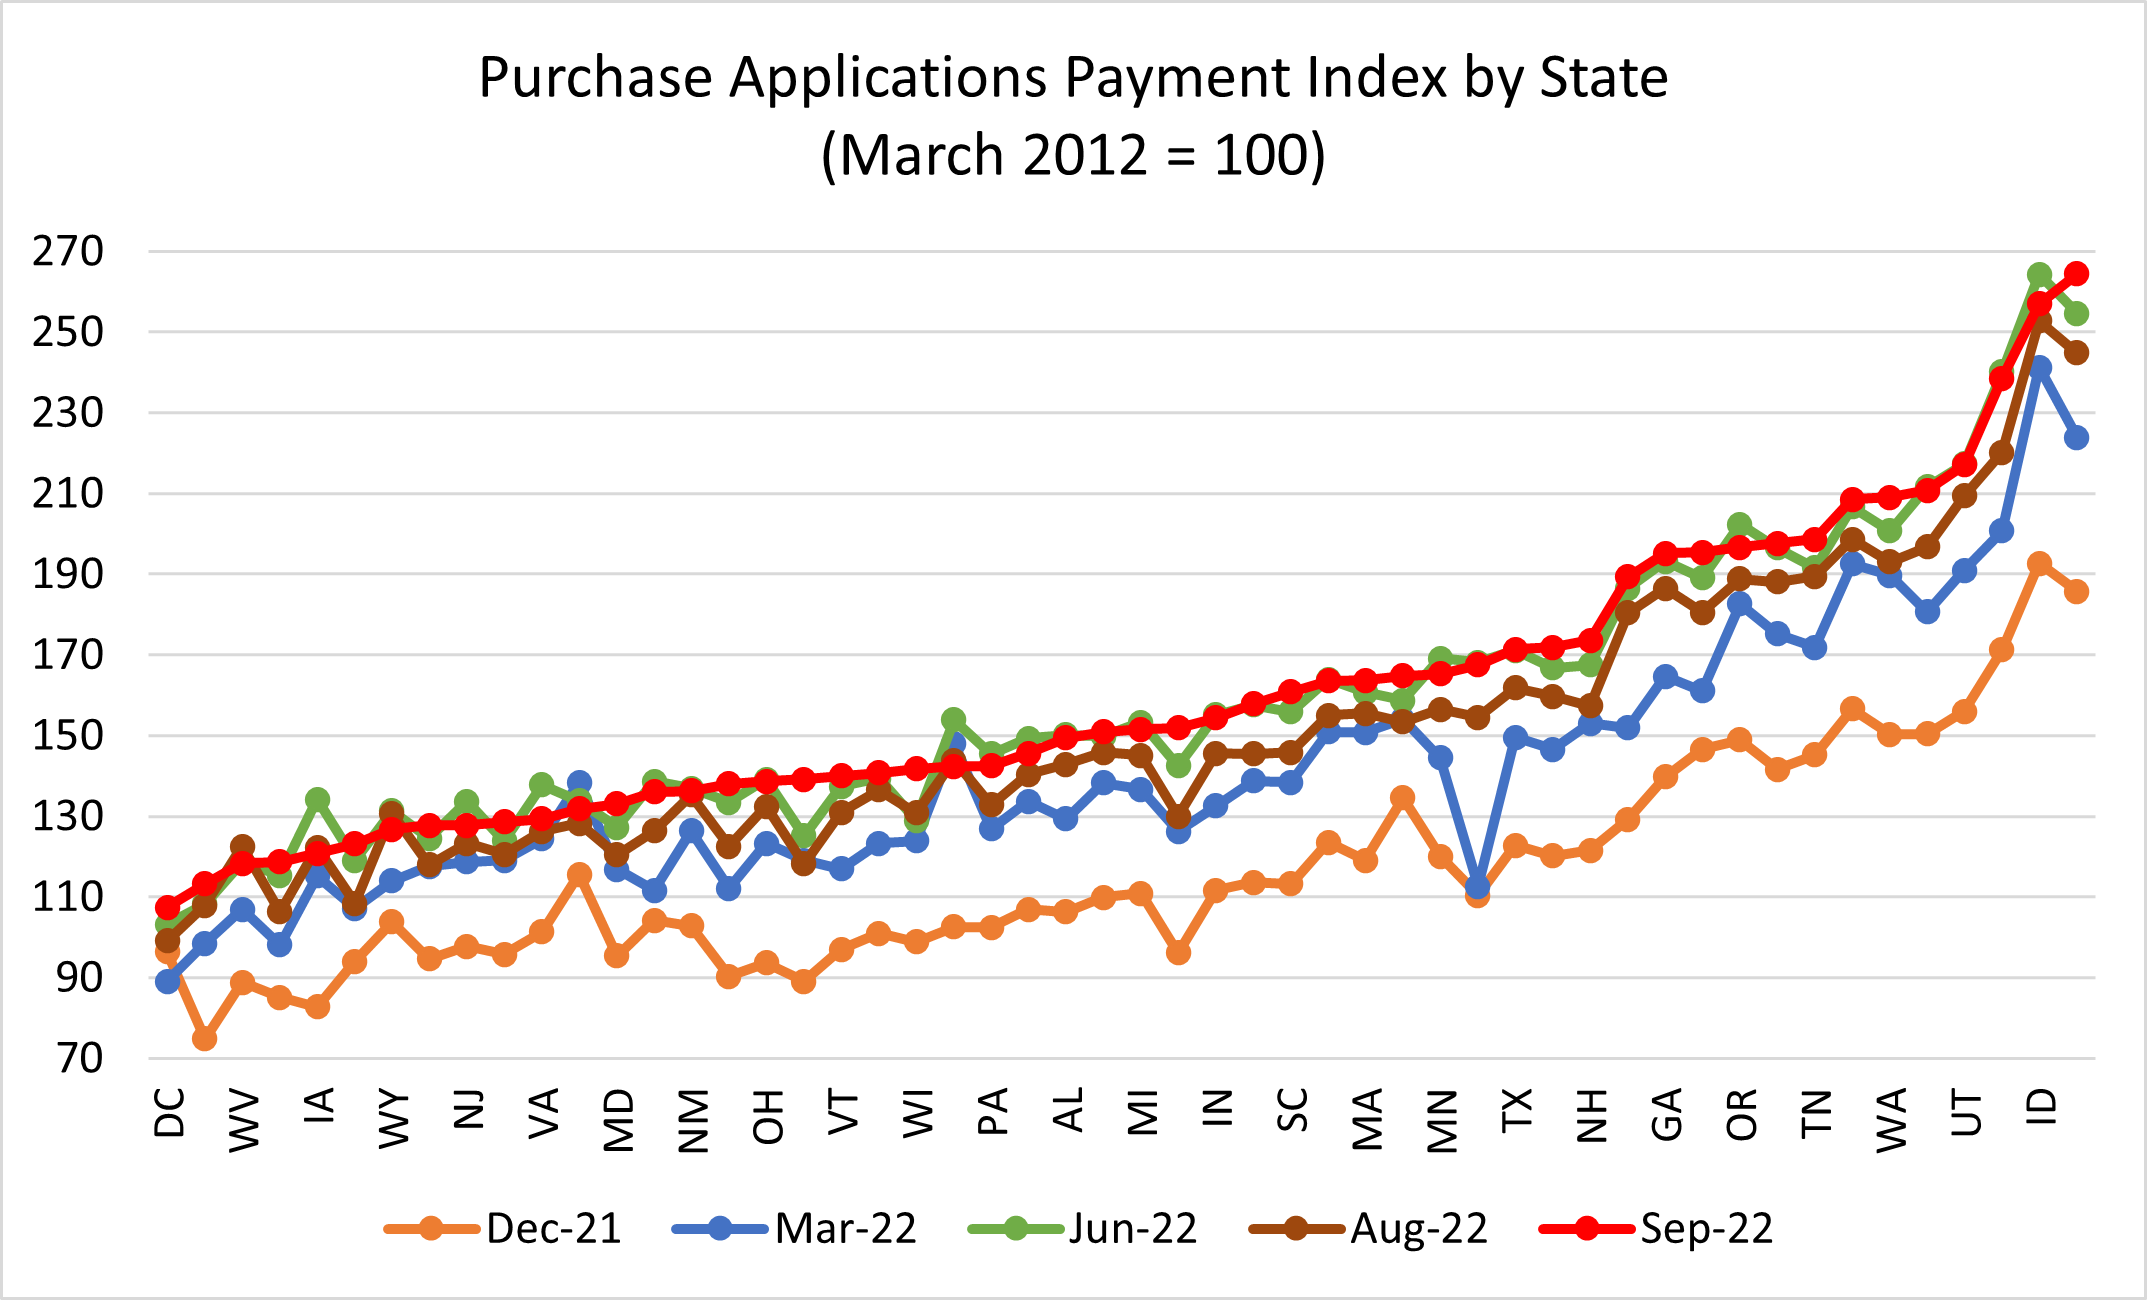
- The top five states with the highest PAPI were: Nevada (264.4), Idaho (257.0), Arizona (238.5), Utah (217.0), and Florida (210.7).
- The top five states with the lowest PAPI were: Washington, D.C. (107.4), Connecticut (113.2), West Virginia (118.3), Alaska (118.7), and Iowa (120.7).
- Homebuyer affordability decreased for Black households, with the national PAPI increasing from 155.4 in August to 164.0 in September.
- Homebuyer affordability decreased for Hispanic households, with the national PAPI increasing from 142.0 in August to 149.9 in September.
- Homebuyer affordability decreased for White households, with the national PAPI increasing from 155.3 in August to 163.9 in September.
To read the full report, including more data, charts and methodology, click here [1].