


According to the American Enterprise Institute, the Nation's longest home price boom has ended after a run-up lasting 10½ years. Since prices peaked in June, there has been month-to-month declines of 0.5%, 0.4%, and 0.2% in September, August, and July, according to data from the American Enterprise Institute's Housing Center.
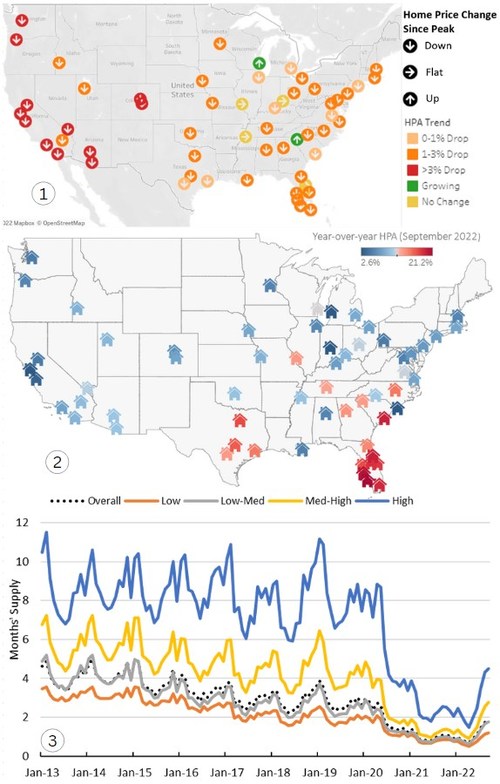
Out of the 60 largest metros, 51 have had a decline from their respective peak home price levels, and only 2 are still growing. San Jose, San Francisco, and Seattle, Washington, had the biggest declines from their peaks at -10.7%, -8.5%, and -8.2% (see #1 in graphic).
September's year-over-year Home Price Appreciation (HPA) was 10.3%, down from 11.6% a month ago, a year-over-year peak of 17.2% in March 2022, and 15.8% a year ago. Based on Optimal Blue rate lock data, year-over-year HPA is projected to decline to further 9.2% in October 2022 and 7.4% in November, meanwhile year-over-year HPA is expected to slow to 4%-6% for December 2022.
Year-over-year HPA varied significantly among the 60 largest metros. It ranged from 2.6% and 3.4% in San Francisco and San Jose to 21.2% and 20.6% in Cape Coral and North Port (see #2 in graphic).
Historically, HPA in the low price tier outpaced HPA in the upper price tiers. This trend continues to hold true. Although home prices were down across all four price tiers, the high end and low end of the market were hit differently. In September, high price tier was down 3.7% from its peak in May 2022, while low price tier was down 0.5% from its peak in July.
September months' supply and active listings both increased above seasonal trends, but remain at historically low levels. Months' supply stood at 1.9 months in September 2022, down from 2.8 months in September 2019, but up from 1.7 months in August 2022, and 0.7 months in April 2022 (see #3 in graphic).
To read the full report, including more charts and methodology, click here.


