Homebuyer affordability improved in November, with the national median payment applied for by applicants decreasing 1.8 percent to $1,977 from $2,012 in October [1], according to the Mortgage Bankers Association's (MBA) Purchase Applications Payment Index (PAPI). The PAPI measures how new monthly mortgage payments vary across time – relative to income – using data from MBA’s Weekly Applications Survey (WAS).
“Slower home-price growth and a 26-basis-point decrease in mortgage rates led to a slight improvement in homebuyer affordability in November,” said Edward Seiler, MBA's Associate VP, Housing Economics, and Executive Director, Research Institute for Housing America. “While the median purchase application increased by $2,444 to $297,444, the amount is more than $40,000 below the peak of $340,000 hit in February 2022. MBA expects both mortgage rates and home-price growth to moderate, which may encourage additional buyers to return to the housing market in the coming months.”
 [2]
[2]
An increase in MBA’s PAPI – indicative of declining borrower affordability conditions – means that the mortgage payment to income ratio (PIR) is higher due to increasing application loan amounts, rising mortgage rates, or a decrease in earnings. A decrease in the PAPI – indicative of improving borrower affordability conditions – occurs when loan application amounts decrease, mortgage rates decrease, or earnings increase.
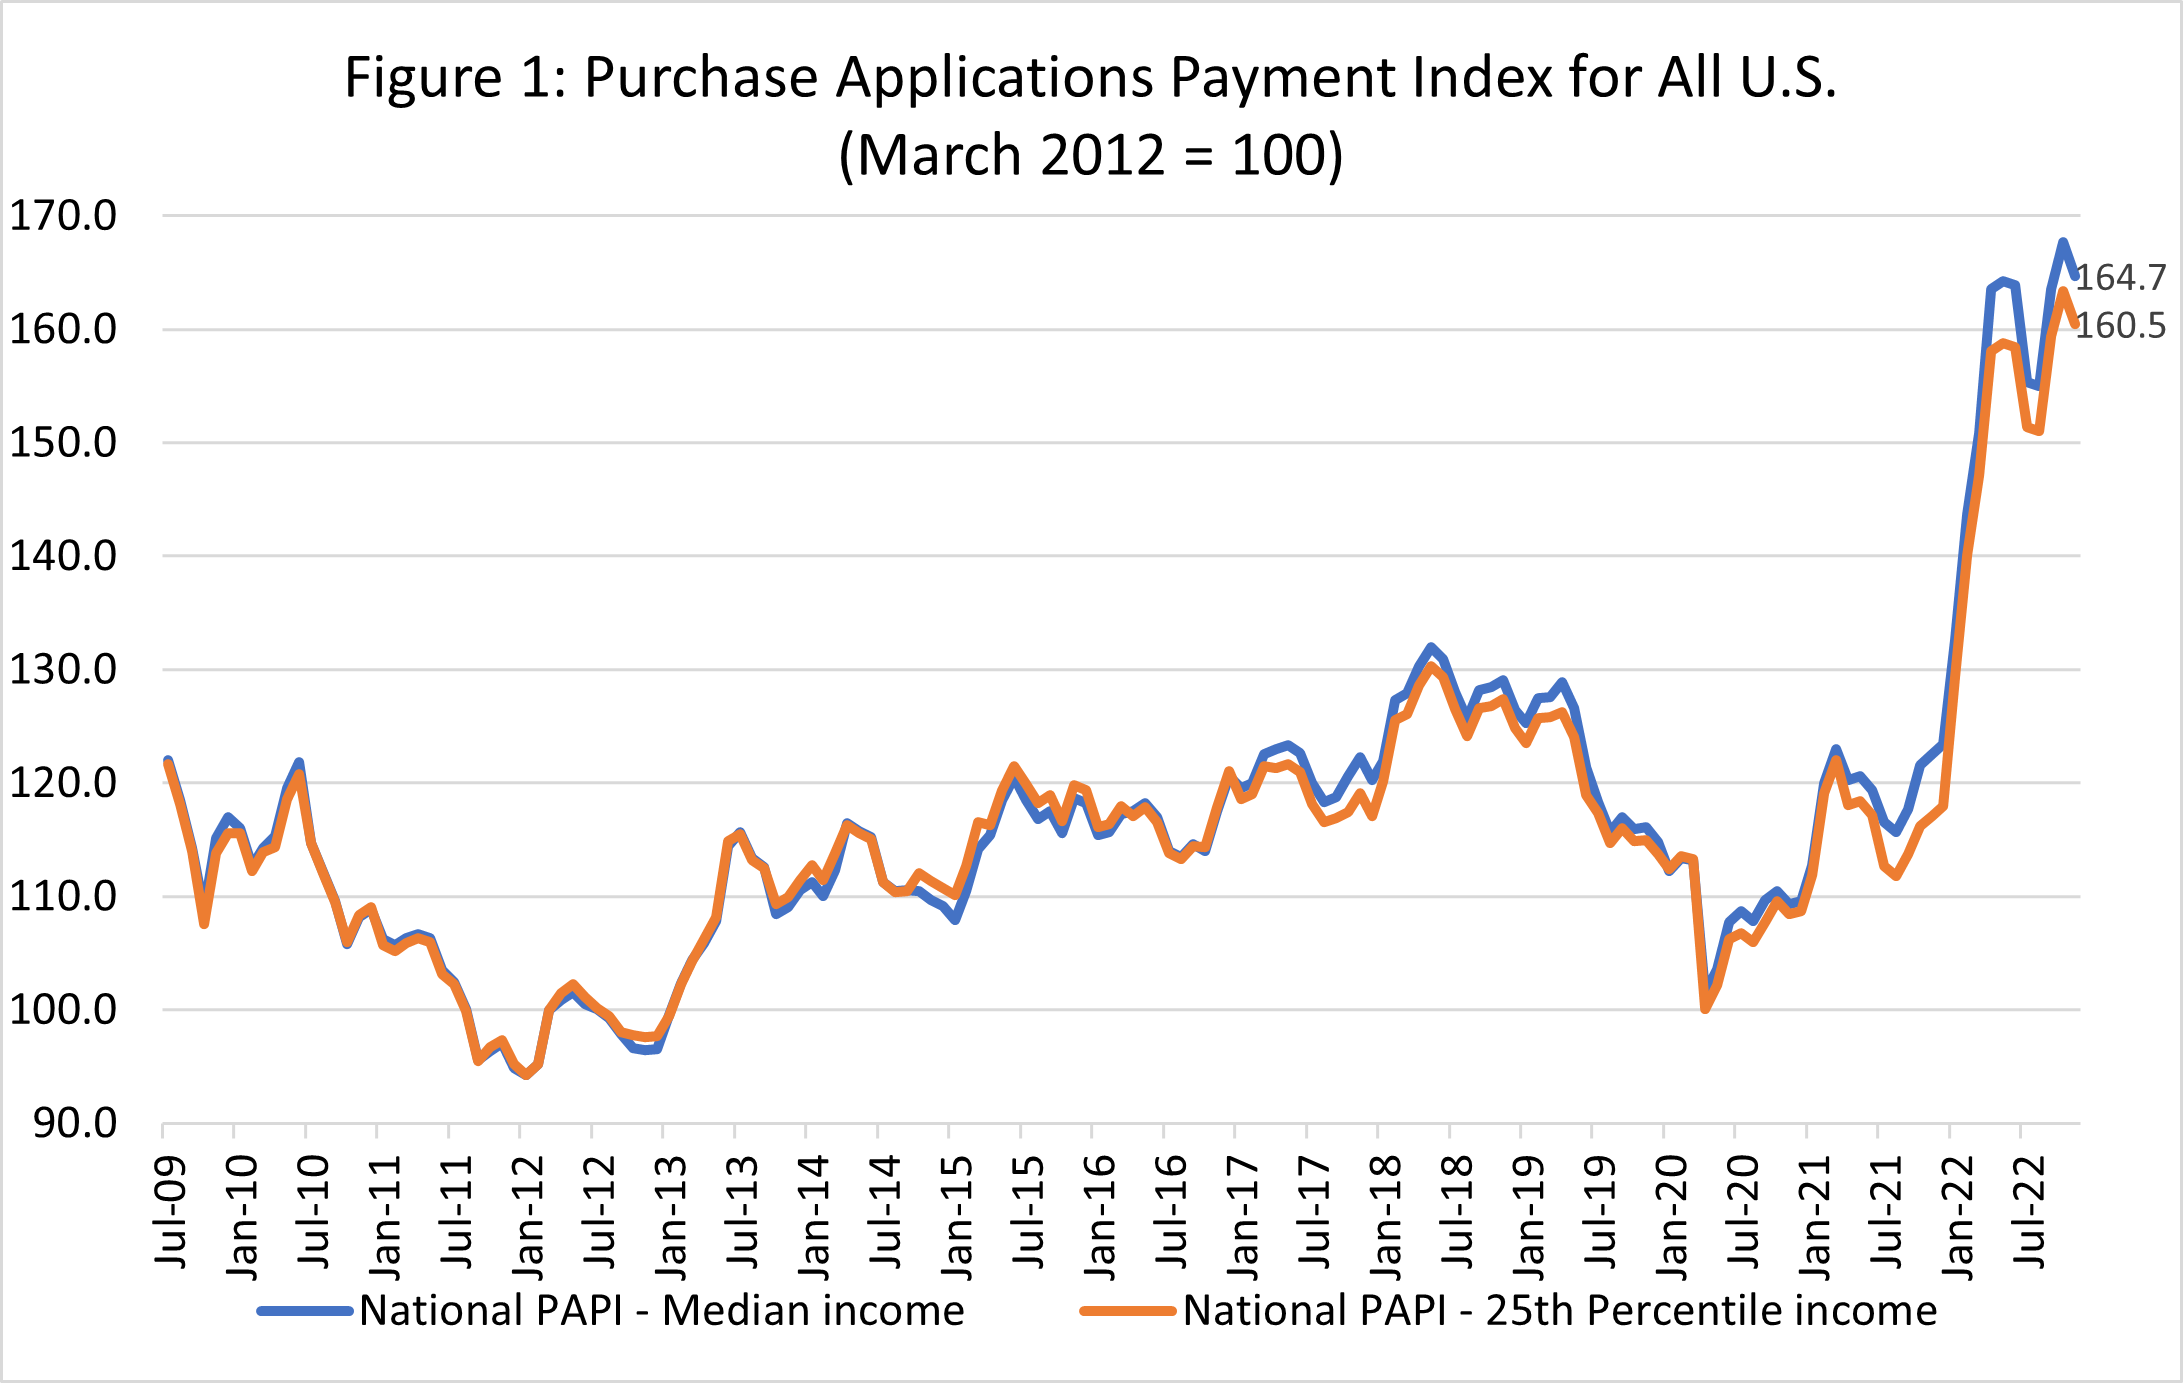
The national PAPI (Figure 1) decreased 1.8% to 164.7 in November from 167.6 in October, but is still at the second-highest level dating back to July 2009. Compared to November 2021 (122.6), the index has jumped 33.4% in the first eleven months of 2022. For borrowers applying for lower-payment mortgages (the 25th percentile), the national mortgage payment decreased to $1,289 in November from $1,323 in October.
 [3]
[3]
Additional Key Findings of MBA's Purchase Applications Payment Index (PAPI) – November 2022
- The national median mortgage payment was $1,977 in November, down from $2,012 in October but up from $1,941 in September. Mortgage payments have increased by $594 in the first eleven months of the year, equal to a 42.9% increase.
- The national median mortgage payment for FHA loan applicants was $1,631 in November, down from $1,666 in October and up from $1,059 in November 2021.
- The national median mortgage payment for conventional loan applicants was $1,994, down from $2,047 in October and up from $1,444 in November 2021.
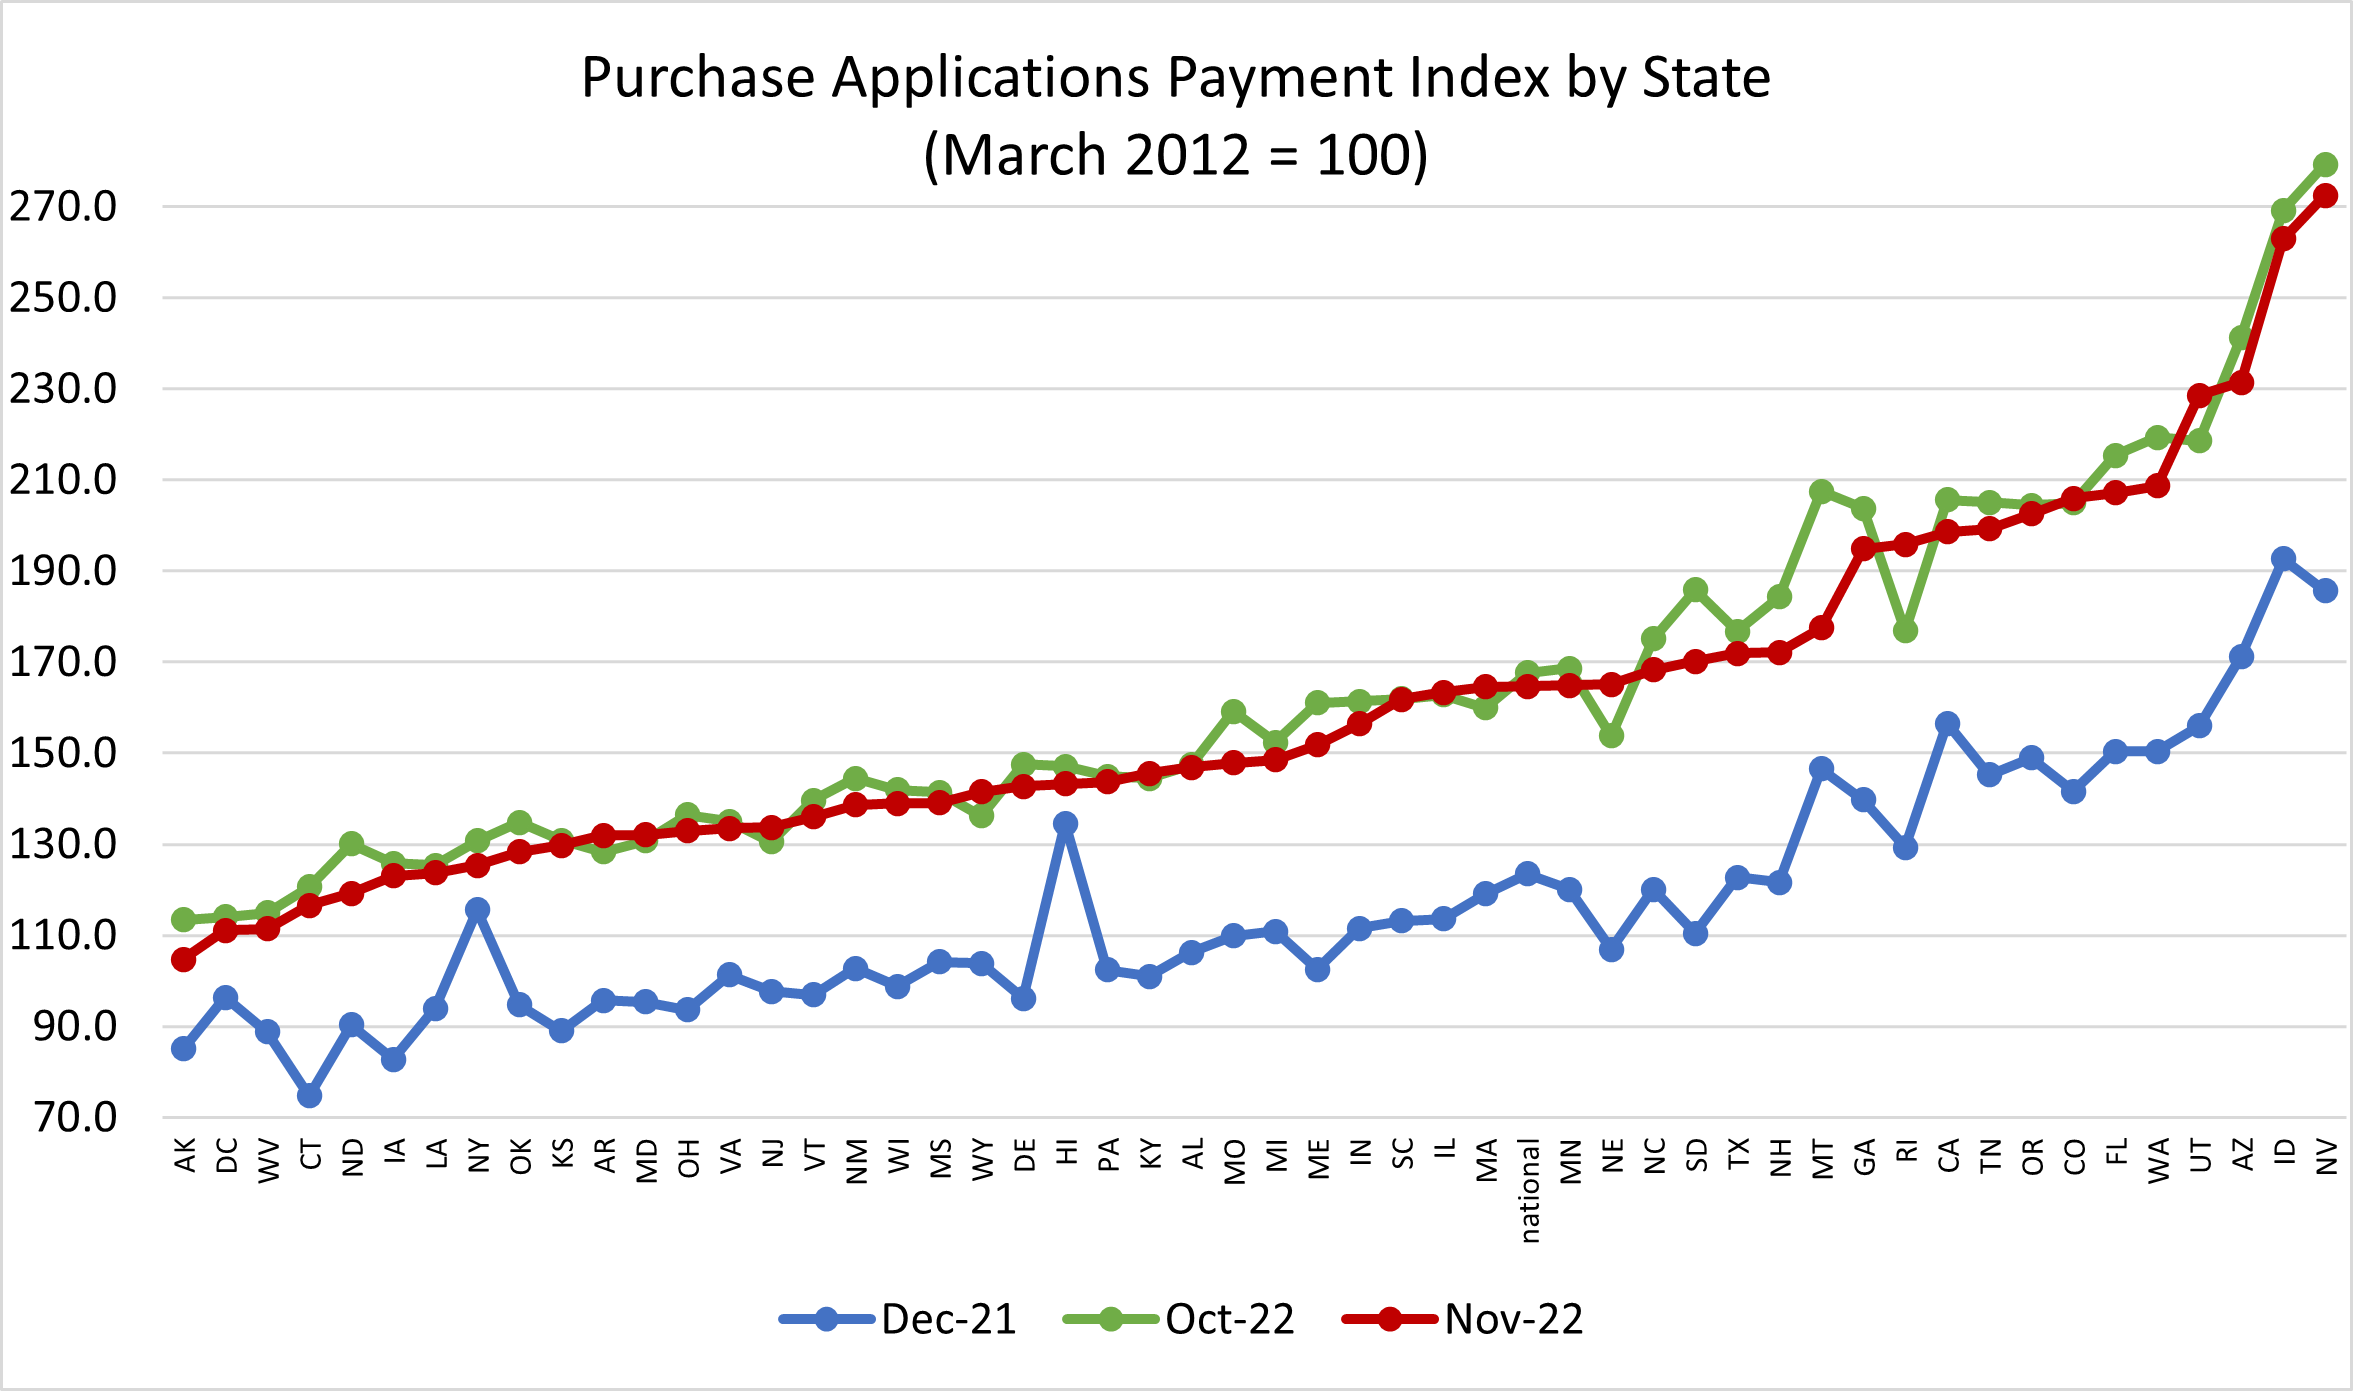
- The top five states with the highest PAPI were: Nevada (272.4), Idaho (262.9), Arizona (231.4), Utah (228.6), and Washington (208.7).
- The top five states with the lowest PAPI were: Alaska (104.7), Washington, D.C. (111.1), West Virginia (111.4), Connecticut (116.5), and North Dakota (119.2).
- Homebuyer affordability increased for Black households, with the national PAPI decreasing from 168.1 in October to 165.2 in November.
- Homebuyer affordability increased for Hispanic households, with the national PAPI decreasing from 153.6 in October to 150.9 in November.
- Homebuyer affordability increased for White households, with the national PAPI decreasing from 168.0 in October to 165.0 in November.
To read the full report, including more charts, data and methodology, click here [1].