


 There was a lot of optimism surrounding household formation just two years ago. In 2014, the U.S. Census Bureau's fourth quarter Housing Vacancy Survey (HVS) found that annual household formation jumped to nearly 2 million, leading analysts to believe that household formations—a fundamental economic driver that generates demand for as many as three out of every four new housing units—was finally out of its recession-era trouble.
But no. Over the last two quarters, the HVS has shown household growth estimates plummeting to only about half a million per year, which is not that much better than the worst readings from the recession.
Troubled by the new estimates, Fannie Mae studied the underlying factors for the volatility in its latest Housing Insights report. According to that report, a historically large increase in the HVS housing unit occupancy rate during late 2014 and a divergence during the last two years between the survey's housing stock growth estimates and independent data on new housing construction have contributed to the recent swings in the survey's household formation estimates.
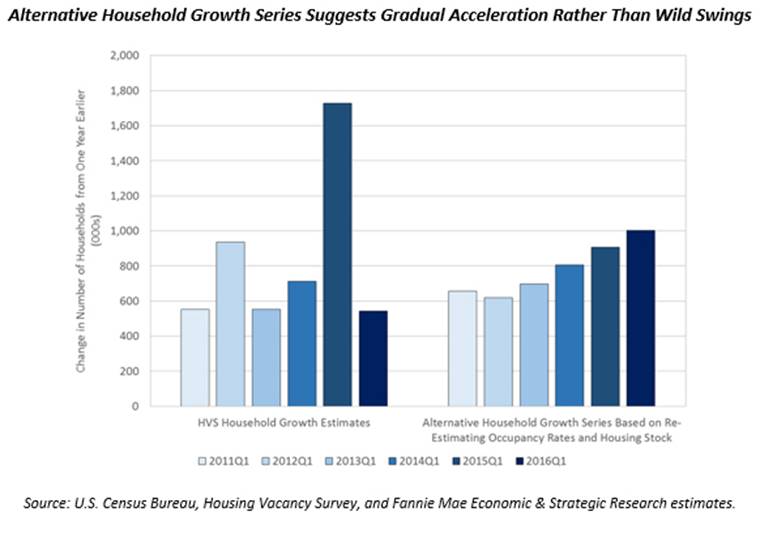
Part of the excitement two years ago was that Q4 2014 was the largest spike in housing formation ever, surging from 736,000 to nearly 2 million. The late-2014 spike in the HVS household formation estimate was credited to pent-up Millennial housing demand finally being released, and pretty much everyone expected that housing market recovery was shifting into fifth gear, according to Fannie.
But HVS estimates of occupancy rates flattened at around 87 percent after the Q4 2014 surge. According to Fannie, key housing stock estimates used in the HVS have not increased much either.
“Since Q3 2014, growth in the housing stock has flattened at about 770,000 units per year,” the report states. At the same time, new housing production (i.e., single-family and multifamily housing unit completions and manufactured home shipments) has continued to accelerate from 900,000 units per year to more than 1 million units.
“Because the HVS housing occupancy rate has stagnated over the past year, and because the independent housing stock estimates aren’t increasing very rapidly,” the report states, “HVSbased estimates of household growth have dropped substantially in recent quarters.”
Nevertheless, Fannie’s alternative household growth estimates see household growth on a gradual path of recovery from the severe downturn of the Great Recession, not as a rollercoaster.
“The alternative series indicates that about one million households were added during the most recent year, a level of growth consistent with estimates produced by other researchers using different methodologies,” the report states. “These alternative household growth estimates should temper some of the late-2014 exuberance and allay some of the more recent concerns over the trajectory of household formation. They suggest that recent trends in household growth are consistent with a gradual, albeit frustratingly plodding, housing market recovery.”


