


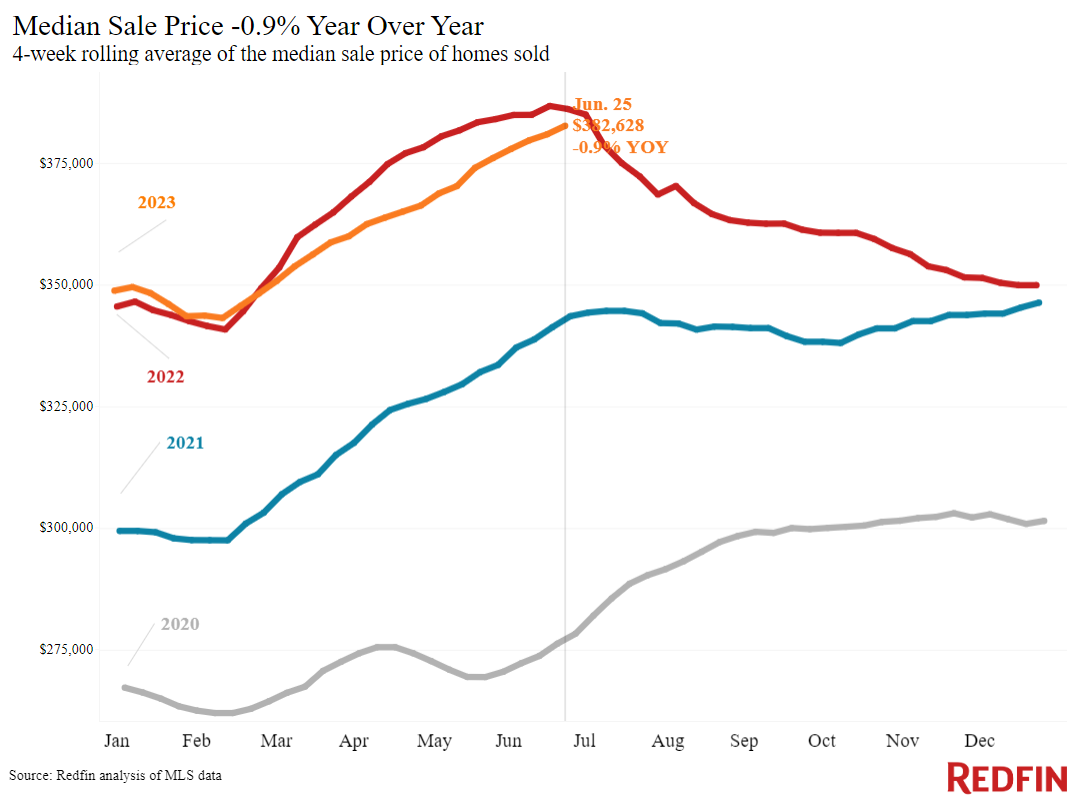
The typical U.S. home is selling for roughly $383,000, only about $4,000 less—an estimated -1%—than the all-time high set last June, representing the smallest year-over-year drop in nearly four months, according to a new report from Redfin.
This is the second time since last August that the sale-to-list price ratio has hit 100%; in other words, the average home is now selling for its asking price.
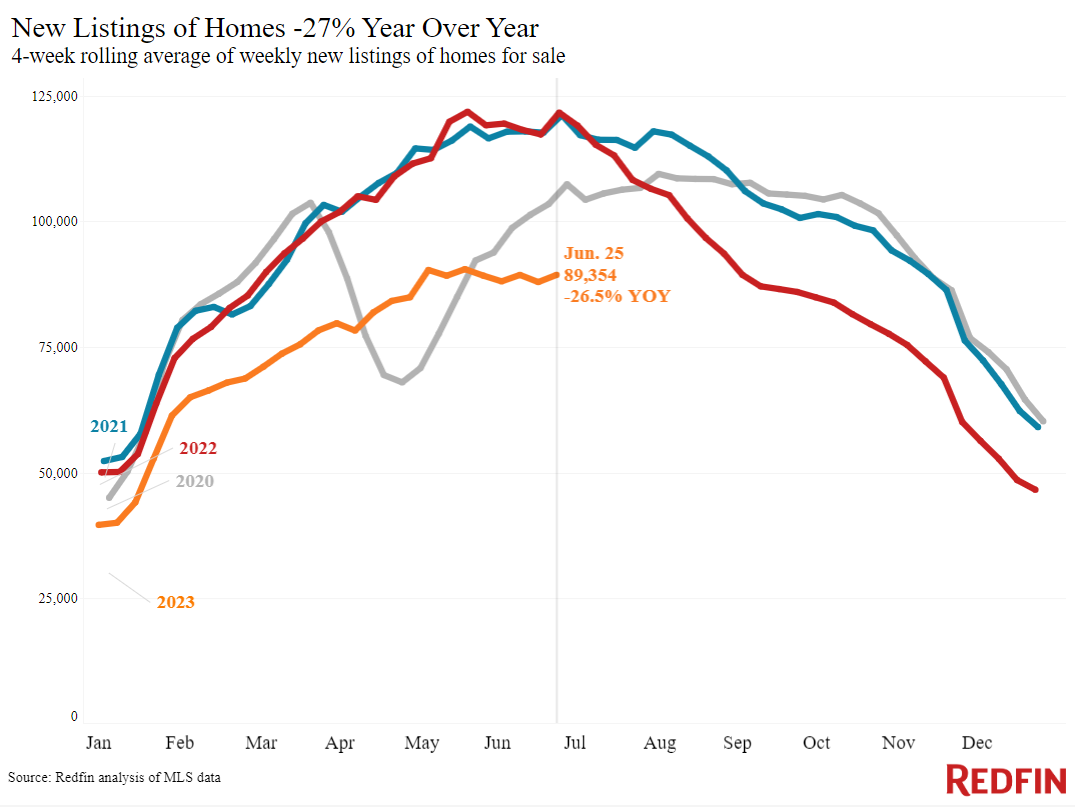
A significant lack of homes for sale is keeping home prices afloat. Additional data revealed new listings fell 27% from a year earlier during the four weeks ending June 25, the biggest drop since the start of the pandemic. That has contributed to the total number of homes for sale declining 11%, the first double-digit drop in over a year.
Inventory is falling because of high mortgage rates, with many homeowners staying put to hang onto their comparatively low rates. Although the average 30-year mortgage rate has inched down in recent weeks, it’s still near 7%, more than double 2021’s record-low levels.
The daily average 30-year fixed mortgage rate was 6.91% on June 28, down from a half-year high of 7.14% a month earlier. For the week ending June 22, the average 30-year fixed mortgage rate was 6.67%, down slightly from the eight-month high of 6.79% hit at the beginning of the month.
High rates are also deterring homebuyers, but they still outnumber home sellers. Pending home sales are down 15%, significantly smaller than the drop in new listings. That means homebuyers are snapping up inventory faster than it’s being listed, which is keeping home prices elevated.
“The market isn’t nearly as fast as it was 18 months ago, when homes were flying off the market for well over asking price, and it’s not as slow as it was six or seven months ago, when mortgage rates first shot up,” said Oakland, CA, Redfin Premier agent Andrea Chopp. “Buyers should keep in mind that desirable homes are getting multiple offers and selling above asking price. And sellers should know that their home may not attract as much competition as their neighbor’s home did two years ago, but it will sell if they price it fairly and put effort into marketing. Things like making small repairs and staging are important again.”
Leading indicators of homebuying activity:
Mortgage-purchase applications during the week ending June 23 rose 3% from a week earlier, seasonally adjusted. Purchase applications were down 21% from a year earlier.
The seasonally adjusted Redfin Homebuyer Demand Index—a measure of requests for home tours and other homebuying services from Redfin agents—hit its second-highest level since May 2022 during the week ending June 25. It was up 10% from a year earlier, the fifth consecutive annual increase. Demand was dropping at this time in 2022 as mortgage rates rose.
Google searches for “homes for sale” were up 5% from a month earlier during the week ending June 24, and down about 9% from a year earlier.
Touring activity as of June 21 was up 9% from the start of the year, compared with a 6% decrease at the same time last year, according to home tour technology company ShowingTime. Tours increased slowly during this time last year as mortgage rates shot up.
Key housing market takeaways for 400+ U.S. metro areas:
- The median home sale price was $382,628, down 0.9% from a year earlier, the smallest decline in nearly four months. Price declines have been shrinking for the last two months.
- Home-sale prices declined in 25 metros, with the biggest drops in Austin, TX (-11% YoY), Las Vegas (-8.7%), Detroit (-8.4%), Oakland, CA (-7.5%), and Phoenix (-6.9%).
- Sale prices increased most in Providence, RI (8.8%), Milwaukee (8.1%), Miami (7.3%), Fort Lauderdale, FL (6%), and Cincinnati (5.1%).
- The median asking price of newly listed homes was $398,225, up 0.3% from a year earlier.
- The monthly mortgage payment on the median-asking-price home was $2,630 at a 6.67% mortgage rate, the average for the week ending June 22. That’s down slightly from the record high hit a month earlier, but up 9% ($206) from a year earlier.
- Pending home sales were down 14.5% year-over-year, continuing a 13-month streak of double-digit declines.
- Pending home sales fell in all but one of the metros Redfin analyzed. They declined most in Cleveland (-24.8% YoY), New York (-24.8%), Milwaukee (-24.3%), Providence (-22.2%), and Cincinnati (-20.4%). They were up slightly (+0.5%) in Austin.
- New listings of homes for sale fell 26.5% year-over-year, the biggest decline since May 2020.
- New listings declined in all metros Redfin analyzed. They fell most in Las Vegas (-45.3% YoY), Phoenix (-43.3%), Oakland, CA (-38.8%), Seattle (-38%), and Riverside, CA (-37.1%).
- Active listings (the number of homes listed for sale at any point during the period) dropped 11% from a year earlier, the biggest drop since April 2022. Active listings were essentially flat from a month earlier; typically, they post month-over-month increases at this time of year.
- Months of supply—a measure of the balance between supply and demand, calculated by the number of months it would take for the current inventory to sell at the current sales pace—was 2.6 months, near the lowest level in a year. Four to five months of supply is considered balanced, with a lower number indicating seller’s market conditions.
- Some 32% of homes that went under contract had an accepted offer within the first two weeks on the market, down from 35% a year earlier.
- Homes that sold were on the market for a median of 27 days, the shortest span in 10 months. That’s up from a near-record low of 19 days a year earlier.
- An estimated 36.7% of homes sold above their final list price. That’s the highest share in 10 months but is down from 52% a year earlier.
- On average, 5.5% of homes for sale each week had a price drop, up from 5.2% a year earlier.
- The average sale-to-list price ratio, which measures how close homes are selling to their final asking prices, was 100%. That marks just the second time in 10 months that the typical home is selling at its asking price, on average. It’s down from 102% a year earlier.
To read the full report, including more data, charts, and methodology, click here.


