Redfin has released a new data report which shows that during the week ending January 28, inquiries for tours and other buying services from Redfin agents increased by 6% over the previous week.
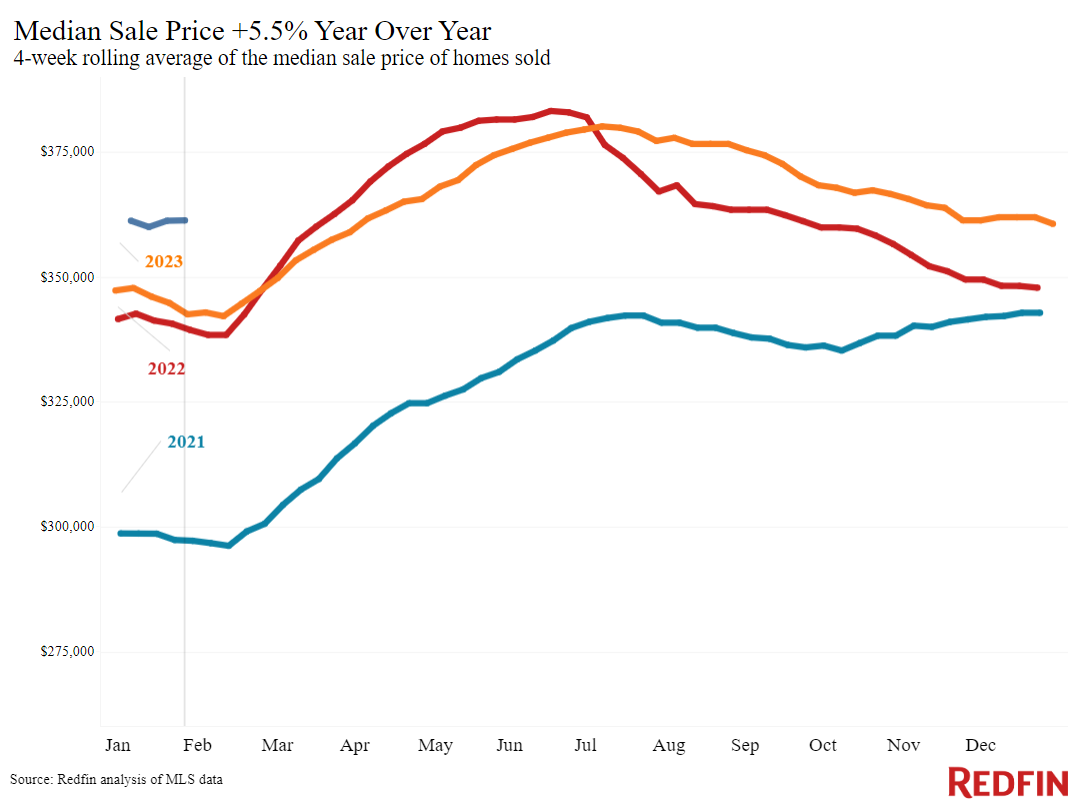
Mortgage rates are still below 7%, which is a decrease from 8% in October of last year, and more homebuyers are viewing properties because they fear that if they wait any longer, prices would rise much higher. The four weeks that concluded on January 28 saw the largest increase in sale prices in more than a year, up 5.5% year-over-year.
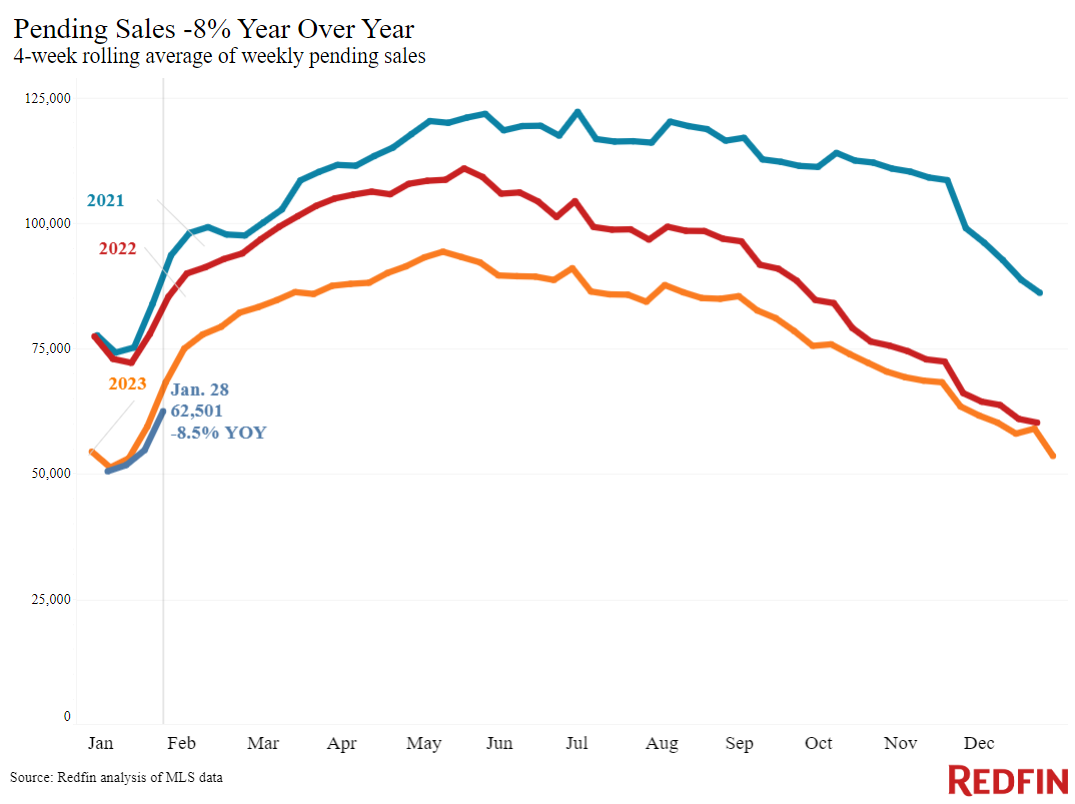
Yet, home sales haven't yet resulted from that initial demand. Applications for mortgage purchases fell from a week earlier, and pending sales had their largest year-over-year drop in four months.
Metros with Biggest YoY Increases in Median Sale Price:
- Anaheim, CA (15.6%)
- Miami (14.7%)
- New Brunswick, NJ (13.3%)
- West Palm Beach, FL (12.9%)
- Detroit (11.8%)
The median sale price declined in only two metros in 2023: Austin, TX (-5.6%) and San Antonio (-2.1%).
Metros with Biggest YoY Decreases in Pending Sales:
- Portland, OR (-31.2%)
- San Antonio (-31%)
- Denver (-30.6%)
- Nashville, TN (-18.7%)
- New Brunswick, NJ (-17.6%)
Pending sales increased in just three metros in 2023: San Francisco (11.5%), San Jose, CA (10.9%), and Anaheim, CA (1.7%).
Metros with Biggest YoY Increases in New Listings:
- Fort Lauderdale, FL (26.5%)
- Phoenix (23.1%)
- San Diego (22.6%)
- Miami (22.3%)
- Minneapolis (19.9%)
Overall, new listings declined in 16 U.S. metros in 2023.
Top 5 Metros with Biggest YoY Decreases in New Listings:
- Denver (-20.8%)
- Chicago (-18.7%)
- Atlanta (-15.9%)
- Portland, OR (-10.5%)
- Nashville, TN (-9.8%)
Although bad weather kept many would-be buyers indoors, daily average mortgage rates crept up from their December low point, and the usual steps buyers take before qualifying for a mortgage were less than anticipated in mid-January.
“I thought declining mortgage rates and more inventory would cause the market to take off right at the start of the new year. But even though demand has picked up some, I’m not wowed,” said Hal Bennett, a Redfin Premier agent in the Seattle area. “Now I believe this year’s market will launch in the spring, once 6% rates are even more entrenched in buyers’ psyches and more homeowners list their houses.”
Leading Indicators of Homebuying Demand and Activity:
- The weekly average 30-year fixed mortgage rate was 6.75% as of the week ending January 31, up from 6.6% a week earlier but near the lowest level since May. This represents a year-over-year (YoY) increase of 6.13%, according to Freddie Mac.
- Mortgage-purchase applications were down 11% from a week earlier, up 10% from a month earlier, as of the week ending January 26, down an overall 20% YoY, according to the Mortgage Bankers Association (MBA).
- The Redfin Homebuyer Demand Index was down 3% from a month earlier as of the week ending January 28, down 17% YoY.
- Google searches for “home for sale” were up 25% from a month earlier as of January 27, down 16% YoY, according to Google Trends.
- Touring activity was up 9% from the start of the year as of January 30. At this time last year, it was up 5% from the start of 2023, according to ShowingTime.
Key Housing Market Data (for the four weeks ending January 28):
- The median sale price was $361,245, representing a 5.5% YoY change, marking the biggest increase since October 2022.
- The median asking price was $392,349, representing a 7% YoY change, marking the biggest increase since September 2022.
- The median monthly mortgage payment was $2,595 at a 6.69% mortgage rate, representing a 12.3% YoY change, down roughly $120 from the all-time high set in October 2023 but up roughly $250 from the four weeks ending December 31.
- Pending sales were 62,501, representing an -8.5% YoY change—the biggest decline since October 2023.
- New listings were 65,722, representing a 4.9% YoY change.
- Active listings were 743,508, representing a -3.8% YoY change.
- Months of supply were 4.8 months, representing a +0.2 percentage point increase YoY.
- Median days on market were 47, down -2 days YoY.
- The share of homes sold above the list price was 22.8%, up from 21% YoY.
- The share of homes with a price drop was 5.2%, representing a +0.3 percentage point increase YoY.
- The average sale-to-list price ratio was 98.2%, representing a +0.5 percentage point increase YoY.
Over the coming months, Redfin experts anticipate that the rise in tours will translate into an improvement in pending sales. This is partially due to standard seasonality: as springtime draws near, so do home listings and sales.
To read the full report, including more data, charts, and methodology, click here.