


 The S&P CoreLogic Case-Shiller Index found additional gains in May, the latest data made available by the report, as the top-20 major metropolitan markets reported month-over-month price increases for the third consecutive month.
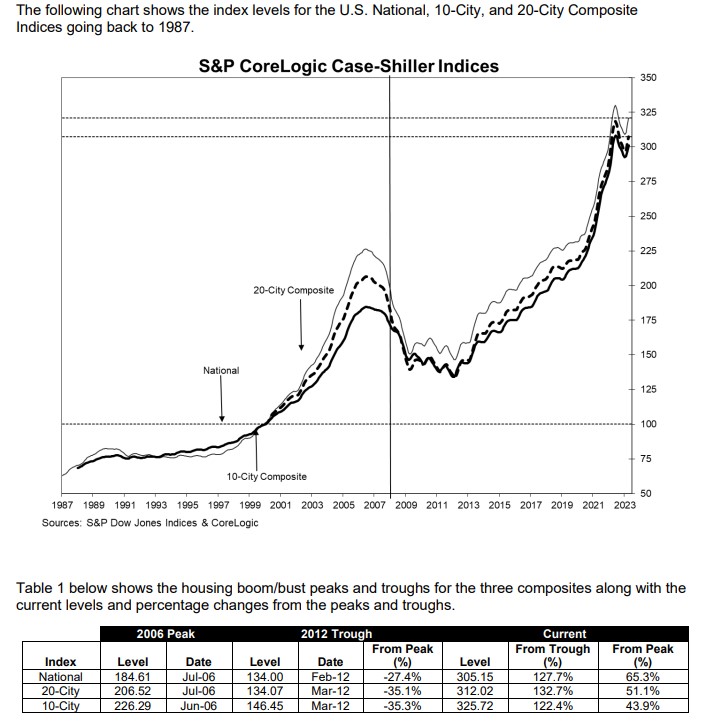
On a yearly basis, The S&P CoreLogic Case-Shiller U.S. National Home Price NSA Index, covering all nine U.S. Census Bureau divisions, reported a -0.5% annual decrease in May, down from a loss of -0.1% in the previous month. The 10-City Composite showed a decrease of -1.0%, which is a tick up from the -1.1% decrease in the previous month. The 20-City Composite posted a -1.7% year-over-year loss, same as was recorded in April 2023.
Chicago, Cleveland, and New York reported the highest year-over-year gains among the top-20 cities—Chicago increased the most out of the group, reporting a 4.6% year-over-year increase, while Cleaveland came in second with a 3.9% increase.
Not taking seasonal adjustments into account, the U.S. National Index posted a 1.2% month-over-month increase in May, while the 10- and 20-city composities both increased at a rate of 1.5%.
After seasonal adjustment, the U.S. National Index posted a month-over-month increase of 0.7%, while the 10-City Composite gained 1.1% and 20-City Composites posted an increase of 1.0%.
“The rally in U.S. home prices continued in May 2023,” says Craig J. Lazzara, Managing Director at S&P DJI. “Our National Composite rose by 1.2% in May, and now stands only 1.0% below its June 2022 peak. The 10- and 20-City Composites also rose in May, in both cases by 1.5%.”
“The ongoing recovery in home prices is broadly based. Before seasonal adjustment, prices rose in all 20 cities in May (as they had also done in March and April). Seasonally adjusted data showed rising prices in 19 cities in May, repeating April’s performance. (The outlier is Phoenix, down 0.1% in both months.) On a trailing 12-month basis, the National Composite is 0.5% below its May 2022 level, with the 10- and 20-City Composites also negative on a year-over-year basis.”
“Regional differences continue to be striking. This month’s league table shows the Revenge of the Rust Belt, as Chicago (+4.6%), Cleveland (+3.9%), and New York (+3.5%) were the top performers. If this seems like an unusual occurrence to you, it seems that way to me too. It’s been five years to the month since a cold-weather city held the top spot (and that was Seattle, which isn’t all that cold). Since May 2018, the top-ranked cities have been Las Vegas (12 months), Phoenix (33 months), Tampa (5months), and Miami (9 months).”
“At the other end of the scale, the worst performers continue to cluster near the Pacific coast, with Seattle (-11.3%) and San Francisco (-11.0%) at the bottom. This month the Midwest (+2.7%) unseated the Southeast (+2.1%) as the country’s strongest region. The West (-6.9%) remains weakest.”
“Home prices in the U.S. began to fall after June 2022, and May’s data bolster the case that the final month of the decline was January 2023. Granted, the last four months’ price gains could be truncated by increases in mortgage rates or by general economic weakness. But the breadth and strength of May’s report are consistent with an optimistic view of future months.”
CoreLogic’s Chief Economist Dr. Selma Hepp explained the market fluctuations this way: “In May, the CoreLogic S&P Case-Shiller Index fell by 0.5% year over year, indicating the second month of year-over-year losses. However, while the annual decline reflects price drops that occurred in 2022, recent above-average price gains indicate an inflection ahead. And while home sales activity still continues to tell a tale of two markets: one of the West, which is constrained by a lack of existing inventory, and the other of the Southeast and South, where the availability of new homes for sale is creating sales opportunities; home prices are not necessarily following the trend anymore.”
“Price gains have been strongest in Mid-West pandemic-laggers, Cleveland, Chicago, Detroit, which are now the hottest housing markets. In addition, 11 metros saw reacceleration in annual prices. Prices in many of the previously declining West Coast markets are rebounding and showing some renewed vigor, particularly as those are also most constrained with a lack of homes for sale,” Hepp concluded. “Heating of competition among buyers is also reflected in an increasing share of home selling over the asking price again, 39%, compared to an average of 25% pre-pandemic. As a result, median price premium (ratio of sale price to list price) is back to positive, at 1%, after declining since last September.”


