


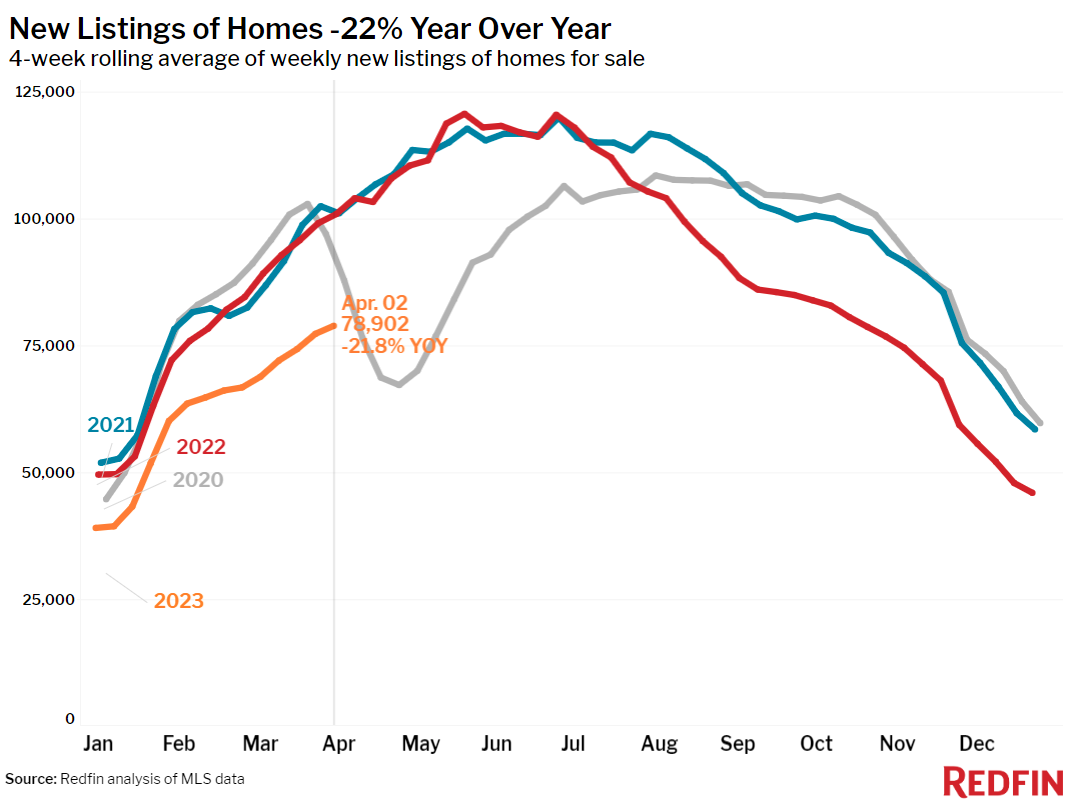
According to a new report from Redfin, the pool of homes available to homebuyers is shrinking quickly because new listings are scarce. New listings fell 21.8% from a year earlier nationwide during the four weeks ending April 2, one of the biggest drops since the start of the pandemic, contributing to an unseasonal early-spring decline in the total number of homes for sale.
Many homeowners are staying put because they’re unwilling to give up their low mortgage rate. Although average 30-year mortgage rates posted their fourth-straight decline this week, dropping to 6.28%, that’s more than double the sub-3% rates common in 2021.
Homebuyers are snatching up the homes that do hit the market extremely fast. Of the homes going under contract, nearly half are doing so within 14 days. That’s up from about one-quarter at the start of the year, an unusually quick winter increase. It would take 2.8 months for today’s supply of for-sale homes to sell at homebuyers’ current consumption rate, the shortest time since September. That’s a sharp drop from the three-year high of 4.5 months in late January and it marks the fastest winter decline in months of supply since at least 2015, in percentage terms.
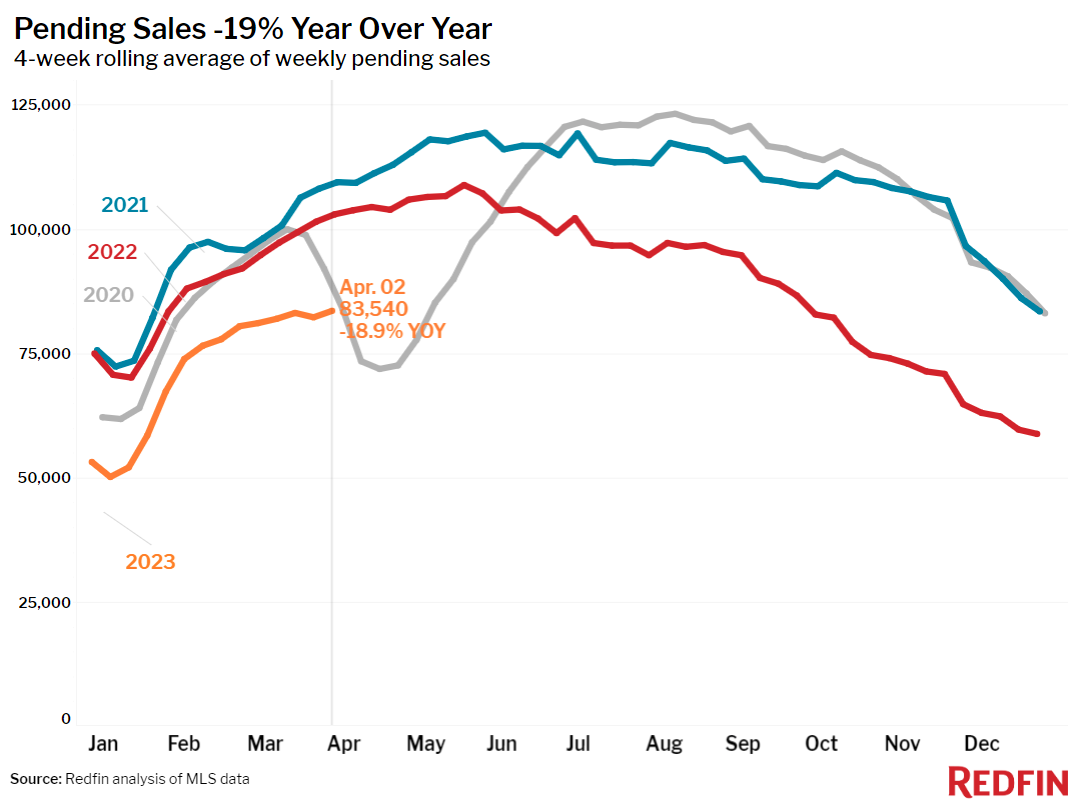
Still, pending home sales are down 19% year-over-year, nearly as much as new listings. That’s partly because homebuying demand is lower than it was last year and partly because so few homes are hitting the market.
“Elevated mortgage rates are perhaps an even bigger deterrent for would-be sellers than for would-be buyers. Giving up a 3% mortgage rate for one in the 6% range is a tough pill to swallow,” said Redfin Deputy Chief Economist Taylor Marr. “Today’s serious homebuyers have grown accustomed to the idea of a 5% or 6% rate and have adjusted their budgets accordingly. The lack of homes hitting the market explains why the market is moving fast even though sales are still down. The lack of new listings is also one reason why sales are down: Buyers can’t buy if sellers don’t want to sell.”
While new listings are down in every major U.S. metro, the trend is more drastic in some areas. In Denver, where new listings are declining at roughly the same pace as the national drop and there are just 1.6 months of supply, Redfin agent Stephanie Collins said sellers have the upper hand as long as their home isn’t overpriced.
“Shiny new listings are getting multiple offers and selling fast. The caveat is that they have to be priced correctly from the beginning,” Collins said. “One of my buyers recently made an offer on a move-in ready home in a popular area. The home was priced right in line with the market at $520,000; it received eight offers and went for $560,000 to a competing buyer. That same client just had an offer $35,000 over asking price accepted in the same neighborhood. Sellers are hesitant, partly because it’s not spring 2022 anymore. I’m reminding potential sellers that buyers are out there, and some homes have bidding wars–they just need to price a bit lower than they would have a year ago.”
In Austin, a pandemic homebuying hotspot, buyers can take their time and they have a better chance of getting a home under list price. Inventory is piling up–Austin has 4.4 months of supply, more than almost anywhere in the country–and prices are down nearly 15% year-over-year, more than any other metro.
“Buyers have more power right now. The silver lining of high rates and the slow market we’ve been experiencing here is that some locals are able to buy in neighborhoods they couldn’t have gotten into last year and get contingent offers with small down payments accepted,” said Austin Redfin agent Andrew Vallejo. “But attractive homes that are priced competitively are selling quickly. Sellers are starting to notice, and they’re prepping and pricing their homes accordingly. I think we’ll start to see more listings over the next several months.”
Home Prices Falling in Many Metros, Rising in Others
Home prices dropped in more than half (28) of the 50 most populous U.S. metros, with the biggest drop in Austin, TX (-14.7% YoY). Next come four West Coast metros: Sacramento (-11.7%), Oakland, CA (-10.4%), San Jose, CA (-10.2%) and Seattle (-9.6%). That’s the biggest annual decline since at least 2015 for Seattle.
On the other end of the spectrum, sale prices increased most in Milwaukee, where they rose 11.4% year over year. Next come Fort Lauderdale, FL (8.9%), West Palm Beach, FL (8.2%), Miami (7.9%) and Columbus, OH (6.3%).
On a national level, the median U.S. home-sale price fell 2.1% year-over-year to roughly $362,000, marking the seventh straight week of declines after more than a decade of increases.
Leading indicators of homebuying activity:
- For the week ending April 6, average 30-year fixed mortgage rates dropped to 6.28%, the fourth straight week of declines. The daily average was 6.16% on April 5.
- Mortgage-purchase applications during the week ending March 31 declined 4% from a week earlier, seasonally adjusted. Purchase applications were up 8% from a month earlier, but down 35% from a year earlier.
- The seasonally adjusted Redfin Homebuyer Demand Index – a measure of request for home tours and other homebuying services from Redfin agents – hit its highest level since September during the week ending April 2. It was up 6% from a month earlier, but down 23% from a year earlier.
- Google searches for “homes for sale” were up about 44% from the trough they hit in December during the week ending April 1, but down about 20% from a year earlier.
- Touring activity as of April 1 was up about 20% from the start of the year, compared with a 25% increase at the same time last year, according to home tour technology company ShowingTime.
Key housing market takeaways for 400+ U.S. metro areas:
- The median home sale price was $361,796, down 2.1% from a year earlier. That’s the seventh week in a row of prices declining annually after more than a decade of increases. The latter is according to Redfin’s monthly dataset, which goes back through 2012.
- The monthly mortgage payment on the median-asking-price home was $2,508 at a 6.28% mortgage rate, the current weekly average. Monthly mortgage payments are down slightly from the peak they reached last month, but up 15% ($326) from a year ago.
- The median asking price of newly listed homes was $391,851, up 0.9% year-over-year.
- Pending home sales were down 18.9% year-over-year, the biggest decline in two months aside from the prior four-week period.
- Pending home sales fell in all 50 of the most populous U.S. metros. They fell most in Portland, OR (-53.2% YoY), Las Vegas (-47.5% YoY), Sacramento (-46.5%), San Jose (-44.5%) and Seattle (-43.1%).
- New listings of homes for sale fell 21.8% year-over-year. New listings have been dropping by about 22% on a year-over-year basis for the last month.
- New listings declined in all 50 of the most populous U.S. metros, with the biggest declines in Portland, OR (-50.1% YoY), Sacramento (-46.4% YoY), Oakland (-45.9%), San Francisco (-41.2%) and San Jose (-38.8%). New listings declined least in the South: Austin (-2.5% YoY) saw the smallest drop, followed by Fort Worth (-2.8%), Dallas (-4.2%), Nashville, TN (-6.2%) and Houston (-8%).
- Active listings (the number of homes listed for sale at any point during the period) were up 12.3% from a year earlier, the smallest increase in five months.
- Months of supply — a measure of the balance between supply and demand, calculated by the number of months it would take for the current inventory to sell at the current sales pace — was 2.8 months, down from 3.2 months a month earlier and up from 1.9 months a year earlier.
- Some 47% of homes that went under contract had an accepted offer within the first two weeks on the market, the highest level since June, but down from 53% a year earlier.
- Homes that sold were on the market for a median of 39 days. That’s up from 23 days a year earlier and the record low of 18 days set in May.
- An estimated 27% of homes sold above their final list price, the highest share in more than three months but down from 50% a year earlier.
- On average, 5% of homes for sale each week had a price drop, up from 2.2% a year earlier.
- The average sale-to-list price ratio, which measures how close homes are selling to their final asking prices, was 98.7%, the highest level in five months but down from 101.9% a year earlier.
To read the full report, including more data, charts and methodology, click here.


