


 ATTOM’s 2023 U.S. Home Sales Report, analyzing data from Q2 2023, shows that profit margins on median-priced single-family home and condo sales nationwide increased to 47.7%–the first gain in a year.
The improvement in typical profit margins, from 43.9% in Q1 of 2023, came amid a rebound in the U.S. housing market that pushed the median nationwide home price up 10% quarterly to $350,000. Both the nationwide profit margin and median home price increased after three straight quarterly drop-offs that had begun to reverse a decade-long market boom. And even as seller fortunes turned around in Q2, the typical investment return nationwide did remain below the recent high point of 53.2%, recorded a year earlier during Q2 of 2022.
“Just when it looked like the housing market was flattening out, prices spiked again, which pushed seller profits back up to nearly their highest level in the past decade,” said Rob Barber, CEO for ATTOM. “Stable mortgage rates, an ongoing tight supply of homes for sale and the usual springtime surge in buyer demand appeared to have combined to halt the downturn we started seeing a year ago. It’s way too early to predict another long-term price run-up, especially since buying a home is a financial stretch for so many households around the country. But the second-quarter numbers clearly show the market has more steam left in it, and sellers are reaping the benefits.”
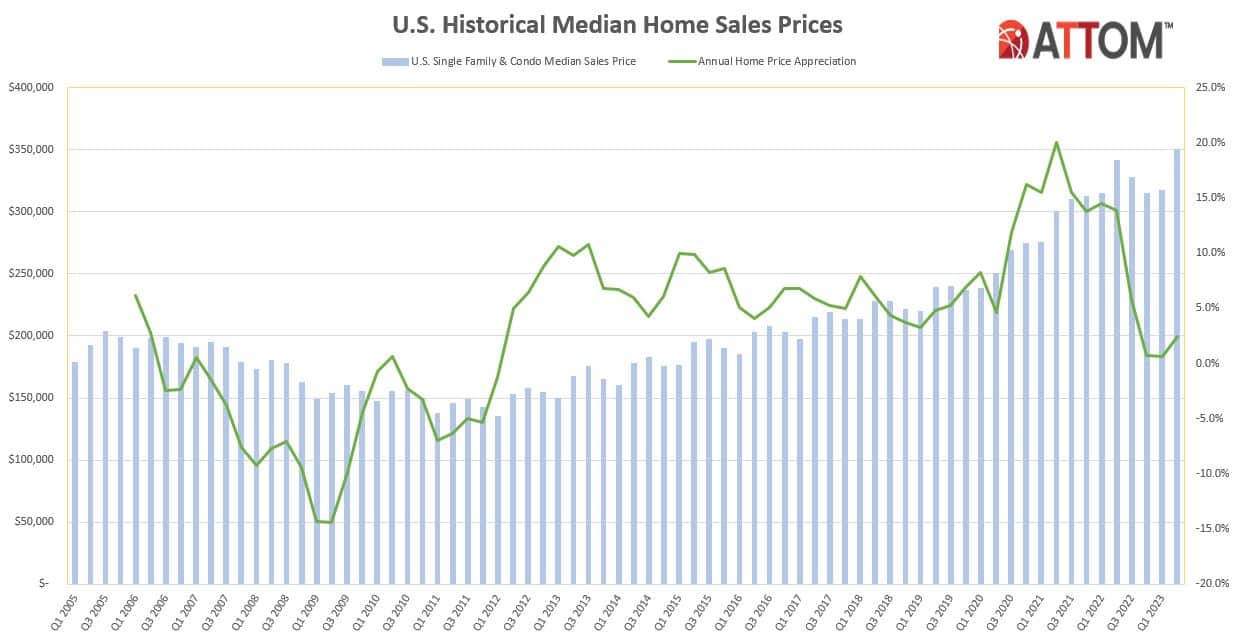
Gross profits also shot up from Q1 to Q2 of 2023, rising 17% on the typical single-family home and condo sale across the country, to $113,000, although down 5% annually. And after a decade of almost continual increases, home prices dipped across most of the country in the middle of 2022, and continued declining through Q1 of 2023. The national median price dropped 7% during that time, as rising home-mortgage rates, high consumer price inflation, and an unsteady stock market cut into what potential buyers could afford.
Typical profit margins–the percent difference between median purchase and resale prices–increased from Q1 of 2023 to Q2 of 2023 in 107 (69 percent) of the 156 metropolitan statistical areas around the U.S. with sufficient data to analyze by ATTOM. However, this total was still down in 118, or 76%, of those metros compared to Q2 of last year, as the recent improvements were not enough to eliminate losses sustained from the middle of 2022 to early 2023.
The biggest quarterly increases in typical profit margins came in the metro areas of:
- Barnstable, Massachusetts (margin up from 47% in Q1 of 2023 to 69.2% in Q2 of 2023)
- Fort Wayne, Indiana (up from 46.7% to 65.5%)
- Augusta, Georgia (up from 45.7% to 64.1%)
- Rochester, New York (up from 50.9% to 68%)
- Charleston, South Carolina (up from 37.7% to 52%)
Aside from Rochester, the biggest quarterly profit-margin increases in metro areas with a population of at least one million in Q2 of 2023 were found in:
- Grand Rapids, Michigan (return up from 63.9% to 76.5%)
- Raleigh, North Carolina (up from 35.8% to 47.7%)
- Hartford, Connecticut (up from 38.5% to 50.1%)
- San Diego (up from 45.3% to 56.7%)
Typical profit margins decreased quarterly in just 49 of the 156 metro areas analyzed (31%). The biggest quarterly decreases were found in:
- Scranton, Pennsylvania (margin down from 86.9% in Q1 of 2023 to 70.2% in Q2 of 2023)
- Hilo, Hawaii (down from 101.5% to 86.7%)
- Detroit (down from 90% to 76%)
- Spartanburg, South Carolina (down from 60.6% to 46.6%)
- Flint, Michigan (down from 91.6% to 80.5%)
Aside from Detroit, ATTOM found the largest quarterly decreases in profit margins among metro areas with a population of at least one million were found in:
- Pittsburgh (down from 50.9% to 40.2%)
- Buffalo, New York (down from 70.9% to 61.5%)
- Indianapolis (down from 48.7% to 40.4%)
- Honolulu (down from 47.1% to 41.1%)
Metro areas with a population of at least one million where typical profits remained down the most annually included:
- Austin, Texas (margin down from 80.3% in Q2 of 2022 to 47.2% in Q2 of 2023)
- San Francisco (down from 85.1% to 59.4%)
- Phoenix (down from 75.8% to 51.6%)
- Salt Lake City (down from 69.3% to 46.4%)
- Las Vegas (down from 66.5% to 46.5%)
Profits on median-priced home sales nationwide, measured in raw dollars, increased from $96,573 in Q1 of 2023 to $113,000 in Q2, a 17% gain. Typical raw profits went up quarterly in 137 (or 88%) of the metro areas analyzed for ATTOM’s report. Annually, however, raw profits remained down 4.6% from a record high of $118,400 in Q2 of 2022. They dropped year-over-year in 65% of the markets analyzed by ATTOM.
The biggest quarterly raw-profit increases in areas with a population of at least one million were found in:
- Birmingham, Alabama (up 47%)
- Rochester, New York (up 44%)
- Louis (up 37%)
- Hartford, Connecticut (up 35%)
- Cleveland, Ohio (up 33 percent).
On an annual basis, the largest year-over-year declines in raw profits on median-priced home sales among metros with a population of at least one million were found in:
- Austin, Texas (down 36%)
- Birmingham, Alabama (down 32%)
- Salt Lake City (down 28%)
- San Francisco (down 27%)
- Phoenix (also down 27%)
The largest raw profits on median-priced sales in Q2 of 2023 were recorded in:
- San Jose (profit of $600,000)
- San Francisco ($416,000)
- San Diego ($301,500)
- Seattle ($285,000)
- Naples, Florida ($265,905)
The smallest raw profits on median-priced sales in Q2 of 2023 were recorded in:
- Shreveport, Louisiana ($14,000)
- Beaumont, Texas ($24,943)
- Rockford, Illinois ($38,140)
- McAllen, Texas ($41,407)
- Toledo, Ohio ($43,000)
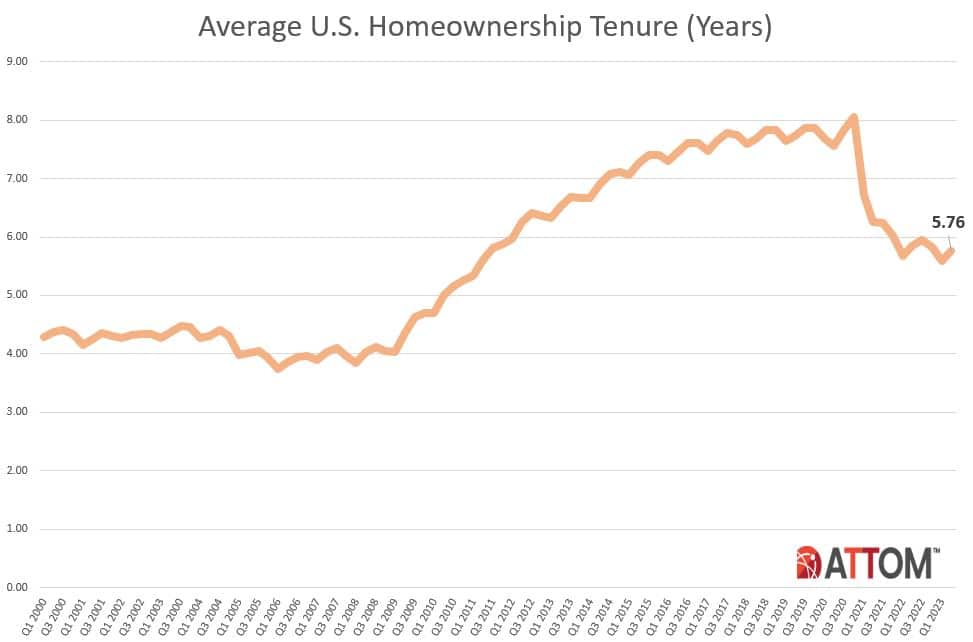
ATTOM found that homeowners who sold in Q2 of 2023 owned their homes an average of 5.76 years, up from a low point over the past decade of 5.59 years in Q1 of 2023, but still down from 5.84 years in Q2 of 2022. The average tenure remained down from Q2 of 2022 to the same period in 2023 in 47% of metro areas with sufficient data, with the largest annual declines recorded in:
- Rockford, Illinois (tenure down 23%)
- Salem, Oregon (down 19%)
- Torrington, Connecticut (down 17%)
- Louis (down 16%)
- Manchester, New Hampshire (down 15%)
All 15 of the longest average tenures among sellers in the second quarter of 2023 were in the Northeast or West regions of the U.S., led by:
- Bellingham, Washington (8.04 years)
- Manchester, New Hampshire (7.88 years)
- Honolulu (7.78 years)
- San Jose (7.38 years)
- Bridgeport, Connecticut (7.26 years)
The smallest average tenures among second-quarter sellers were reported in:
- Lakeland, Florida (1.46 years)
- Memphis (3.23 years)
- Cleveland (3.88 years)
- Salem, Oregon (4.15 years)
- Tucson, Arizona (4.29 years)
Home sales following foreclosures by banks and other lenders represented just 1.4%, or one of every 69, U.S. single-family home and condo sales in Q2 of 2023, down from 1.7% in Q1 of 2023, although up from 1.1% in Q2 of last year. Still, it remained just a small fraction of the 30% peak this century hit in 2009 during the aftermath of the Great Recession of 2007.
Among metropolitan statistical areas with sufficient data, those areas where REO sales represented the largest portion of all sales in Q2 of 2023 included:
- Flint, Michigan (12.5%)
- Albany, New York (6%)
- Lansing, Michigan (5.9%)
- Detroit (5.2%)
- Kalamazoo, Michigan (4.5%)
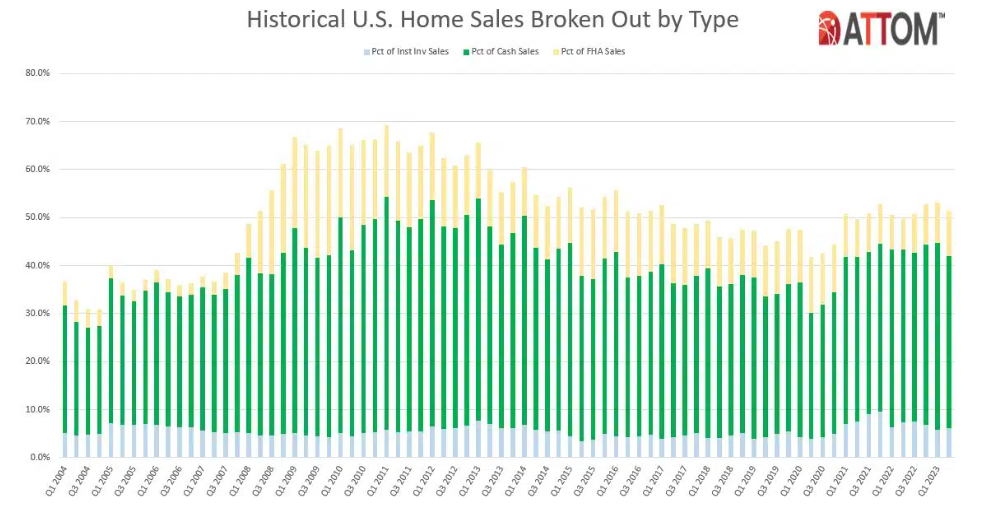
Institutional investors nationwide accounted for 6.1%, or one of every 16, single-family home and condo purchases in Q2 of 2023, up from 5.7% in Q1 of 2023, but still down from 7.4% in Q2 of 2022. Among the states with enough data to analyze, those with the largest percentages of sales to institutional investors in Q2 of 2023 were:
- Georgia (9% of all sales)
- Tennessee (9% of all sales)
- Indiana (8.4% of all sales)
- Oklahoma (8.2% of all sales)
- Texas (8.1% of all sales)
States reporting the smallest levels of sales to institutional investors in Q2 of 2023 included:
- Hawaii (2.4% of all sales)
- New Hampshire (3.1% of all sales)
- Rhode Island (3.3% of all sales)
- Maine (3.6% of all sales)
- New York (3.7% of all sales)
Click here for more information on ATTOM’s 2023 U.S. Home Sales Report for Q2.


