


High home prices are easier to stomach when mortgage rates are ultra-low, but in Q2 of this year, NerdWallet's First-Time Home Buyer Metro Affordability Report revealed climbing prices paired with relatively high interest rates made life even more difficult for potential first-time homebuyers.
In 2022, rates on 30-year mortgages climbed from just over 3% to nearly 7%, and the dramatic increase scared some potential home buyers away from the market. But this year, as buyers understand that these rates are here to stay, demand has returned. Unfortunately for first-time homebuyers, the rates that give them pause are a full-on roadblock for current homeowners with low-rate mortgages who would otherwise sell. This is keeping inventory levels low and maintaining tight competition in a high-priced environment.
First-time homebuyers typically face a tougher market than those buying for the second or subsequent time. The biggest constraint is that they're likely on a stricter budget. This can seriously impact the number of homes available to them, and in a housing market with already-sparse supply, first-time homebuyers willing to brave the environment are in brutal competition with one another.
In Q2 of this year, prices rose, likely in part due to traditional seasonal fluctuations but also due to continued low inventory. The adage that an affordable home is one listed at three times your income has moved further out of reach, according to the report.
Affordability Down Across Large Metros in Q2
The second quarter typically ushers in the homebuying season and higher prices compared with the prior three-month period. In Q2 of this year, that was certainly true, as homes were listed at 5.8 times potential first-time homebuyer income, compared with 5.5 times in Q1 of the year. The decreased affordability was even more pronounced in the country’s 50 most populous metro areas. Among those metros, homes were listed at 6.1 times first-time homebuyer income, compared with 5.6 times in Q1.
Even the most affordable metro areas in NerdWallet's Q2 analysis saw price increases that decreased affordability. Pittsburgh was back to being the only metro where homes are listed within the affordability range at 2.9 times first-time homebuyer income. Other relatively affordable metros include Cleveland (3.5), Detroit, Buffalo, New York, and St. Louis (all 3.7).
Homes in Los Angeles, always the least affordable metro in our analysis, became more unattainable for first-time homebuyers; they were listed at 13.1 times the potential first-time buyer income in Q2. San Diego, where homes were listed at 10.8 times first-time homebuyer income, San Jose, California (9.3), Miami (8.7), and San Francisco (8.2) were among the other least affordable metro areas.
Prices Up for the Season
Home prices rose slightly in Q2—5% across the nation and 7% in the nation’s largest metros, on average—reflecting a fairly typical seasonal bump. Generally, home prices rise in the spring before peaking in June. This wasn’t the case in 2020 and 2021, when prices climbed throughout the year.

But price growth has leveled off slightly when comparing Q2 of this year to last. In fact, prices fell 3% across the nation year-over-year after adjusting for inflation. The two biggest single-year decreases happened in Austin, Texas, where list prices fell 11% compared with last year, and Las Vegas, where they fell 12%. First-time buyer guidance: Price growth has slowed, but prices are still high and unlikely to come down meaningfully anytime soon.
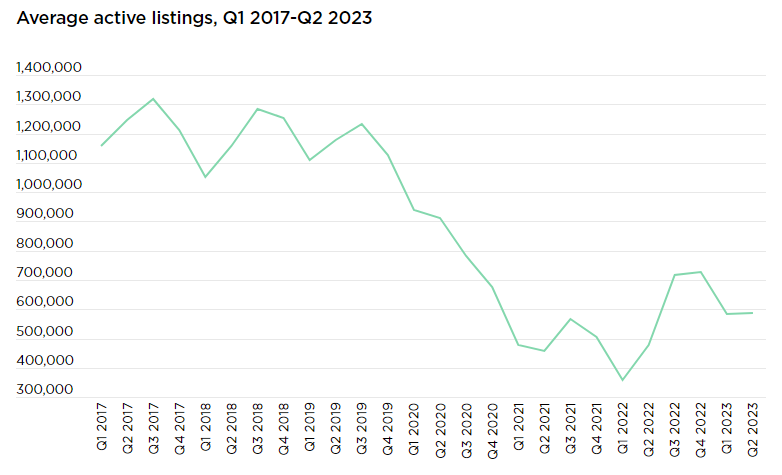
Inventory Steadily Low
Generally, Q2 of the year sees a seasonal increase in inventory over the first, but this year, reluctant homeowners aren’t listing their homes. Across the country and the largest metros, the number of active listings remained steady.
Some metros did see a quarterly upswing in listings, and four saw inventory rise by 20% or more: Milwaukee (+20%), Boston and Austin (+22%), and Denver (+28%). These increases, though a welcome sight to local buyers, are a very small step in the right direction. In Denver, for example, that quarterly increase puts the average number of active listings at 4,470. Compare that with how many listings were on the market in the second quarter of 2019, before the pandemic: 7,780.
Still, things are moving in the right direction. Across the nation, the number of listings was 23% higher than in Q2 of 2022.
Existing homeowners are likely to have a low-rate mortgage, which makes it more tempting to stay put, delaying a sale they might otherwise undertake. This means inventory could remain depressed until rates decrease, and even with mortgage rates tempering demand, competition will remain high.
To read the full report, including more data, charts, and methodology, click here.


