


HouseCanary, Inc. has released its latest Market Pulse report, comparing data between September 2021 and September 2022, revealing that a sharp decrease in demand is driving the housing market cooldown. New data also found that declining demand led to a 19.2% decrease in new listing volume in September, and a 51.0% increase in listing removals, while the volume of price drops are up 83.2% compared to September 2021.
“The most recent round of rate increases has continued to cause a shift in supply-demand fundamentals by impacting demand and creating a flat price growth environment," said Jeremy Sicklick, Co-Founder and CEO of HouseCanary. "Compared to the rate increases in the spring, the market is starting at a different baseline with no momentum to subsequently absorb the slowing of the market volume and price growth. Additionally, the market has seen a 51% increase in listing removals and an 83.2% increase in the volume of price drops over the last year, indicating that declining demand has driven sellers to either reduce their listing prices or remove their homes from the market entirely."

Throughout the year, there has been a continued housing inventory shortage, driven most recently by recurring interest rate hikes as the Federal Reserve tries to combat inflation. Consequently, the post-pandemic housing market has shown a sharp turnaround, with many would-be buyers now deterred by record-high mortgage rates. As 2023 rapidly approaches, HouseCanary insights indicate there will be additional market shifts, with a sharp decrease in demand that is causing sellers to reduce prices or remove listings at a dramatic rate.
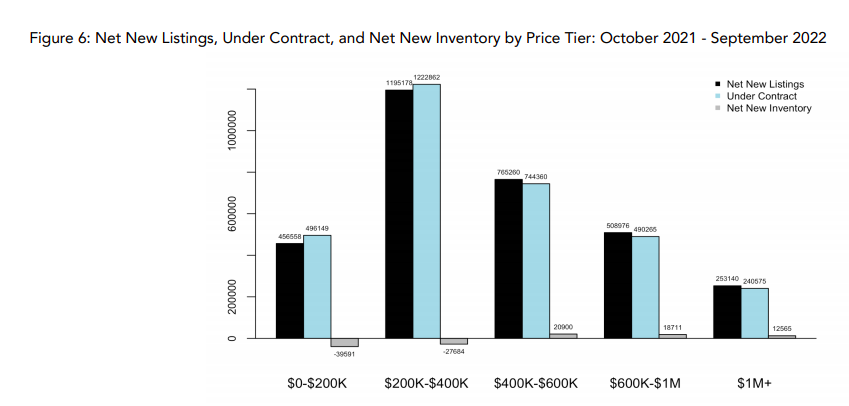
Total Net New Listings:
- Since September 2021, there have been 3,179,129 net new listings placed on the market, which is a 7.6% increase versus the 52 weeks prior.
- Percentage of total net new listings over the last 52 weeks, broken down by home price:
- $0-$200k: 14.4%
- $200k-$400k: 37.6%
- $400k-$600k: 24.1%
- $600k-$1mm: 16.0%
- >$1mm: 7.9%
- Percent change in net new listing activity over the last 52 weeks versus the same period in 2021, broken down by home price:
- $0-$200k: -26.1%
- $200k-$400k: -16.0%
- $400k-$600k: +7.1%
- $600k-$1mm: +11.6%
- >$1mm: +9.9%
Monthly Net New Listing Volume (Single-Family Detached Homes):
- Monthly new listing volume was down 19.2% compared to September 2021
- In September, there were 236,971 net new listings placed on the market, representing a 29.6% decrease year-over-year.
- For the month of September, the percent change in net new listing volume compared to September 2021, broken down by home price:
- $0-$200k: -36.0%
- $200k-$400k: -32.0%
- $400k-$600k: -25.3%
- $600k-$1mm: -24.7%
- >$1mm: -23.2%
Listings Under Contract:
- Over the last 52 weeks, 3,194,231 properties have gone into contract, representing an 11.1% decrease relative to the same period in 2021
- Percentage of total contract volume since September 2021, broken down by home price:
- $0-$200k: 15.0%
- $200k-$400k: 38.3%
- $400k-$600k: 23.3%
- $600k-$1mm: 15.3%
- >$1mm: 7.6%
- Percent change in contract volume over the last 52 weeks versus the same period in 2021, broken down by home price:
- $0-$200k: -23.6%
- $200k-$400k: -18.3%
- $400k-$600k: +1.4%
- $600k-$1mm: +4.7%
- >$1mm: -1.4%
Monthly Contract Volume (Single-Family Detached Homes):
- For the month of September, there were 284,611 listings that went under contract nationwide, which is a 18.9% decrease year-over-year.
- For the month of September, the percent change in contract volume compared to September 2021, broken down by home price:
- $0-$200k: -21.1%
- $200k-$400k: -21.0%
- $400k-$600k: -14.7%
- $600k-$1mm: -15.5%
- >$1mm: -21.3%
Median Listing Price Activity (Single-Family Detached Homes):
- For the week ending September 30, 2022, the median price of all single-family listings in the U.S. was $433,070, a 12.5% increase year-over-year.
- For the week ending September 30, 2022, the median closed price of single-family listings in the U.S. was $399,505, a6.8% increase year-over-year.
- The median price of all single-family listings in the U.S. is down by 0.7% month-over-monthand the median price of closed listings has remained unchanged.
"While the continued supply shortage remains significant, the recent round of increasing rates is taking a bigger toll than those occurring earlier this year," said Sicklick. "The increasing rates are expected to continue to negatively impact the market: creating even lower contract volume and putting additional downward pressure on prices.”
To read the full Market Pulse report for September 2022, including more charts and methodology, click here.


