


According to a new Apartment List study, while rent growth has cooled significantly over the past year, the national median rent is still 23% higher than it was just three years ago, and in some markets, the increase has been even more substantial. Newly released data from the U.S. Census Bureau shows that these rapid increases in housing costs have been taking a meaningful toll on affordability.
According to the most commonly accepted measure of housing affordability, a household is considered “cost-burdened” if housing costs eat up more than 30% of gross household income. Households that spend more than 50% of their household income on monthly housing costs are considered to be “severely” cost-burdened.
The latest estimates from the Census American Community Survey, based on data collected in 2022, show that the share of American renters who are cost-burdened has risen to the highest level since 2012, erasing improvements made in the decade preceding the pandemic. The majority of this increase is attributable to a surge in the number of severely burdened households that spend more than half their income on rent.
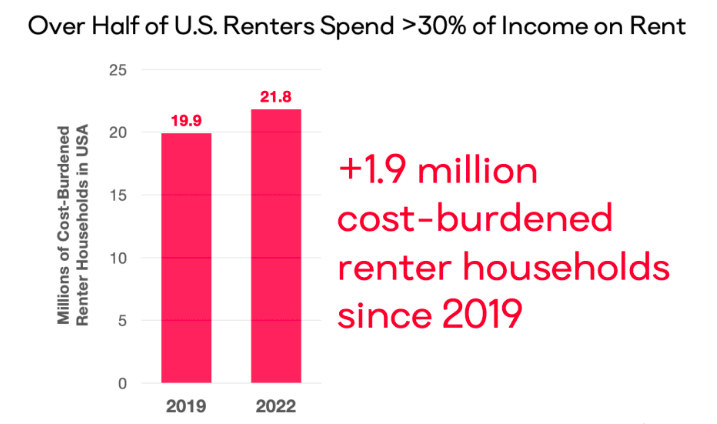
Number of Cost Burdened Renters up 1.9 Million Since 2019
In the five years preceding the pandemic, from 2014 to 2019, the number of cost-burdened renter households fell by 826,000, while the number of renter households who could comfortably afford their rent increased by 1.9 million. But in the following three years, that dynamic has been flipped on its head - the number of cost-burdened renter households has spiked by 1.9 million from 2019 to 2022, while the number of non-burdened renter households fell by 957,000.
As of 2022, there are 21.8 million rent-burdened households, more than ever before. Just over half are severely cost-burdened, and that group has seen the biggest increase in recent years. The number of households that spend more than half of their income on rent spiked by 1.5 million from 2019 to 2022, an increase of 15%.
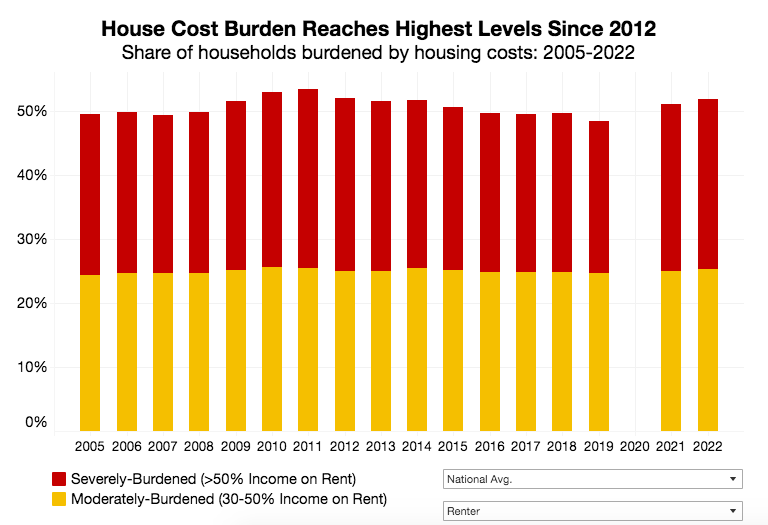
More than half of all renter households qualify as cost-burdened; the cost burden rate rose to 51.9% in 2022, the highest level since 2012. After peaking in 2011 in the aftermath of the Great Recession, cost burden rates had been gradually declining for nearly a decade, and the 48.4% rate in 2019 was the lowest of any year going back to 2005. But after the housing market was upended in the pandemic era, the cost burden rate jumped to 51.1% in 2021 and increased again in 2022.
The share of renters who are moderately cost-burdened—those spending between 30 and 50% of household income on rent—has risen slightly, from 24.7% in 2019 to 25.2% in 2022. Unfortunately, most of the recent increase has come from severely-burdened households that struggle most acutely with their housing costs. The share of severely-burdened renter households increased from 23.7% to 26.7% from 2019 to 2022.
Given the flurry of homebuying activity in late 2020 and 2021, it may be natural to wonder if the increase in renter cost burden is attributable to a compositional effect, as some wealthier renters became homeowners. However, that is not the case. In fact, while the cost burden rate is much lower for homeowners, it has also been rising in recent years due to skyrocketing prices and mortgage rates. As of 2022, 27.9% of homeowners with a mortgage are cost-burdened, up from 26.6% in 2019.
Cost Burden Rates Are Highest in Florida and California Markets
While housing costs are a growing concern in virtually all parts of the country, there is also meaningful regional variation. The map below shows 2022 renter cost burden rates for the 250 largest metros in the U.S.; red shading indicates a cost burden rate above the national average, while blue indicates a rate below the national average.
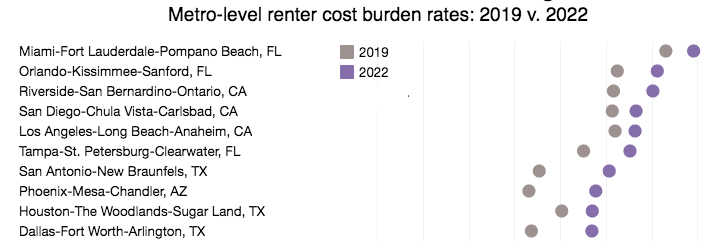
Generally speaking, markets throughout the South and along the coasts tend to have higher cost burden rates, while the middle of the country fairs a bit better. Florida and California, in particular, jump out as hot spots. Miami has the nation’s highest cost burden rate among the 50 largest metros in the U.S., at 64.6%.
The top five are rounded out by Orlando, FL (60.6%); Riverside, CA (60.2%); Sacramento, CA (59.1%); and San Diego, CA (58.3%). At the state level, Florida leads the way with 60.3% of renter households burdened by their housing costs, followed by Hawaii (57.8%), Nevada (57.3%), California (56%), and Louisiana (55.8%).
Rent Burden Has Worsened in 94 of the Nation’s 100 Largest Metros
Even in markets with below-average cost burden rates, the affordability picture is worsening. All but six of the nation’s 100 largest metros saw rent burdens worsen from 2019 to 2022, with rates exceeding 50% in 65 of those metros.
The sharpest increase has been in the Spokane, WA, metro area, where the renter cost burden rate spiked from 44.8% in 2019 to 56.3% in 2022. It should come as no surprise that a market experiencing a rapid surge in rents would see affordability wane. Spokane was one of the original “Zoomtown” destinations when remote work first took hold in the early stages of the pandemic, and according to our latest estimates, rent prices for new leases in the Spokane metro are currently 34% higher than they were in March 2020.
Phoenix serves as another clear example of this same trend playing out in a larger market. As the pandemic accelerated an ongoing influx of new households to the region, rents are up 28%, and the share of cost-burdened renter households has risen from 46.6% in 2019 to 53.9% in 2022.
Cost Burden Is Driven by Rents Rising Faster Than Incomes
The increasing cost burden rate of recent years is rooted in a fairly intuitive cause: rent prices have been growing faster than incomes can keep pace, a notable change to the dynamic of pre-pandemic years.
Renter cost burden peaked at 53.4% in 2011 during the fallout of the Great Recession. But as the economy recovered, so too did renter incomes, particularly in relation to rent prices. From 2011 to 2019, the nationwide median rent rose 26%, while the median renter household income jumped 37%. The cost burden gradually improved as a result, falling five percentage points to 48.4%.
The chart below plots nominal rent growth from 2019 to 2022 against nominal renter income growth over the same period. Each marker represents one of the nation’s 100 largest metros, sized by population, and is shaded based on the change in the metro’s cost burden rate during those same years, with red indicating worsening cost burden and green signaling improvement. In metros sitting above the diagonal line, rents have grown faster than incomes in recent years, whereas in metros below the diagonal, incomes have grown faster than rents.
Notably, in 74 of the 100 largest metros, rents have been growing faster than incomes, and in 94, the cost burden has worsened since 2019. Phoenix, seen toward the top center of the chart, again serves as a clear example: the metrowide median rent increased by 36% from 2019 to 2022, according to Census estimates, while the median income of renter households increased by just 24%, driving one of the nation’s sharpest increases in cost burden.
The U.S. cost burden worsened through the pandemic, from 48 percent of renter households in 2019 to 52 percent in 2022. This is a function of rent growth exceeding income growth; from 2019 to 2022, nominal rents rose 19 percent while renter incomes rose just 16 percent. In 2023 and beyond, this pattern would need to reverse to see an impactful improvement in cost burden.
On one hand, income growth does appear to be accelerating. Preliminary data from the Bureau of Labor Statistics shows that incomes in the second quarter of 2023 are up 5.7 percent year-over-year (1.7% after adjusting for inflation). And while these statistics are not available for renters specifically, other breakdowns show that recent wage growth is higher for lower-earners and non-white workers, who are both more likely to rent.
However, rent growth may also continue on an upward trajectory. This may come as a surprise to astute readers who know that rents are currently down year-over-year, according to the latest Apartment List Rent Index. But remember that our index considers rents paid only by households who are moving and signing new leases, while marketwide rents that go into cost burden calculations consider all households, including the majority who stay put each year and continue with their existing leases.
This is the main difference between our data and CPI inflation data, and while the latter does show annual rent growth starting to decline, it has remained elevated in the 7–9% range throughout 2023 year-to-date. Our data provide strong evidence that marketwide rent measures will continue to fall, but this may not happen quickly enough to trigger an immediate turnaround in cost burden rates.
Taken as a whole, this data emphasizes the scale of the housing affordability crisis in the U.S. For more than half of all renter households, monthly rent payments are eating up a large enough share of their income to put financial stability at risk. And more than one-in-four renter households spend more than half of their income on rent—a level that can often necessitate extreme measures such as overcrowding and cutting back on spending on other basic needs. Thankfully, policymakers have demonstrated an increased focus on this issue in recent years, but solutions are still urgently needed.
To read the full report, including more data, charts, and methodology, click here.


