


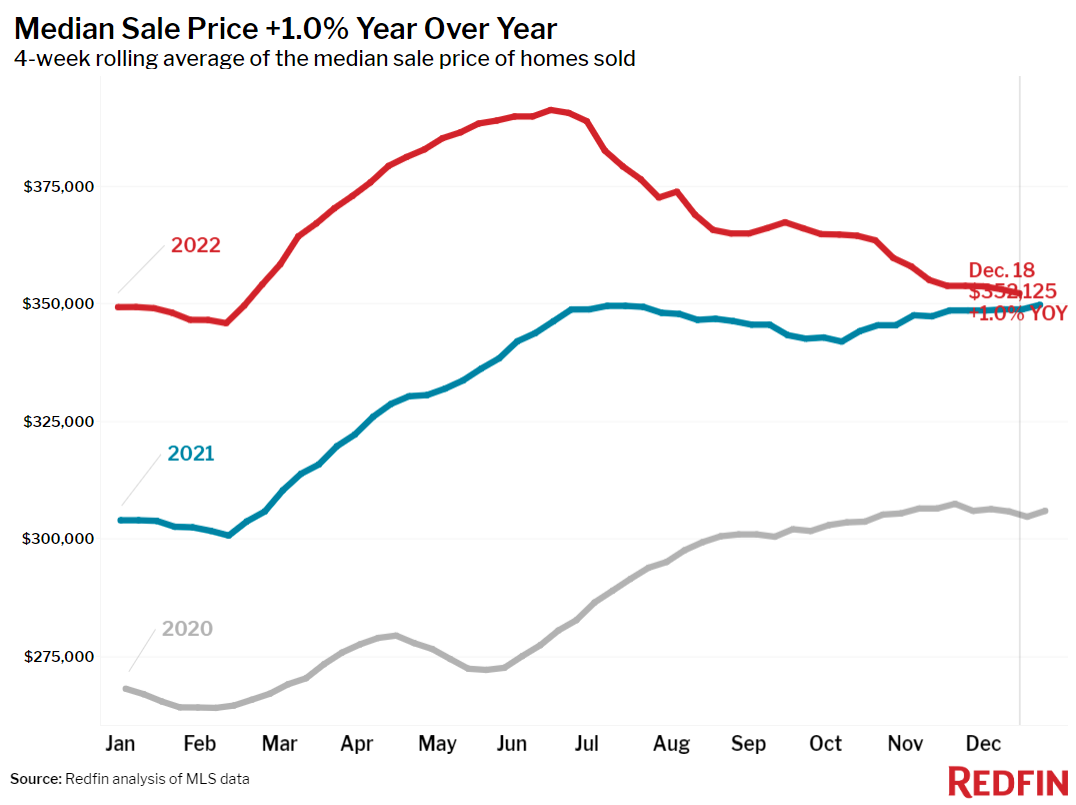
As the market continues to moderate, recent data showed the typical U.S. home sold for roughly $352,000 during the four weeks ending December 18, down 10% from a peak of $391,000 in June and up just 1% year-over-year, according to a new market report from Redfin.
Average mortgage rates declined for the sixth straight week to 6.27%, cutting nearly $300 from the typical homebuyers’ monthly housing payment since it hit a peak in late October with 7% rates. The typical for-sale home was listed for 39 days before going under contract, the longest period since August 2020, contributing to the biggest supply increase on record.
The combination of slowing price growth, lower mortgage payments and homes sitting on sale for well over a month is making the market a bit more favorable for buyers than it was in the fall, and some are starting to return. Mortgage-purchase applications were up 4.6% from a month ago and Redfin’s Homebuyer Demand Index, which tracks requests for tours and other Redfin homebuying services, was up 6.5%.
“Quite a few buyers have come out of the woodwork in the last few weeks as rates have fallen. Many people who were outbid on multiple homes during the buying boom want to seize this moment because they can take their time touring homes and negotiate on price and terms with sellers,” said Seattle Redfin agent Shoshana Godwin. “Today’s market isn’t nearly as hot as it was earlier this year, and I don’t expect it to return to those levels. But it’s getting warm.”
The uptick in early-stage demand hasn’t translated to more pending home sales or new listings. Sales aren’t likely to tick up until mid-January, partly because the holiday season is typically slow, and new listings may not start recovering until spring, according to Redfin economists.
Home prices fell from a year earlier in 14 of the 50 most populous U.S. metros, half of them in California
Home-sale prices fell year-over-year in 14 of the 50 most populous U.S. metros, compared with declines in 5 of the 50 a month earlier.
Prices fell year-over-year in:
- San Francisco (9%)
- Pittsburgh (6.2%)
- San Jose, California (5.8%)
- Los Angeles (4.7%)
- Oakland, California (4%)
- Detroit (3%)
- Austin (2.2%)
- Sacramento (1.9%)
- Phoenix (1.8%)
- Chicago (1.1%)
They declined less than 1% in Riverside, California, New York, Seattle, and Anaheim, California. This marks the first time New York prices have fallen on a year-over-year basis since June 2020. Data shows price declines in Los Angeles, Pittsburgh, and Phoenix are the biggest since at least 2015.
Leading indicators of homebuying activity:
- For the week ending December 22, 30-year mortgage rates ticked down slightly to 6.27%, the sixth straight weekly decrease. The daily average was 6.28% on December 22.
- Mortgage purchase applications during the week ending December 21 were essentially flat from a week earlier and up 4.6% from a month earlier, seasonally adjusted. Purchase applications were down 36% from a year earlier.
- The seasonally adjusted Redfin Homebuyer Demand Index–a measure of requests for home tours and other homebuying services from Redfin agents–was up slightly from a week earlier and up 6.5% from a month earlier during the four weeks ending December 18. It was down 24% from a year earlier.
- Google searches for “homes for sale” were on par with the previous month during the week ending December 17, but down about 30% from a year earlier.
- Touring activity as of December 18 was down 50% from the start of the year, compared to a 27% decrease at the same time last year, according to home tour technology company ShowingTime. The significant declines are likely due in part to the holiday season.
Key housing market takeaways for 400+ U.S. metro areas:
- The median home sale price was $352,125, up 1% year-over-year, the slowest growth rate since the start of the pandemic.
- The median asking price of newly listed homes was $352,450, up 3.6% year over year, the slowest growth rate since the start of the pandemic.
- The monthly mortgage payment on the median-asking-price home was $2,254 at the current 6.27% mortgage rate. That’s down slightly from a week earlier and down $267 from the October peak. Still, monthly mortgage payments are up 36.5% from a year ago.
- Pending home sales were down 32.6% year-over-year, one of the largest declines since at least January 2015, as far back as this data goes.
- Among the 50 most populous U.S. metros, pending sales fell the most from a year earlier in Las Vegas (-63.8%), Phoenix (-58%), Austin (-57.7%), Jacksonville, Florida (-55.7%) and Portland, Oregon (-53.9%).
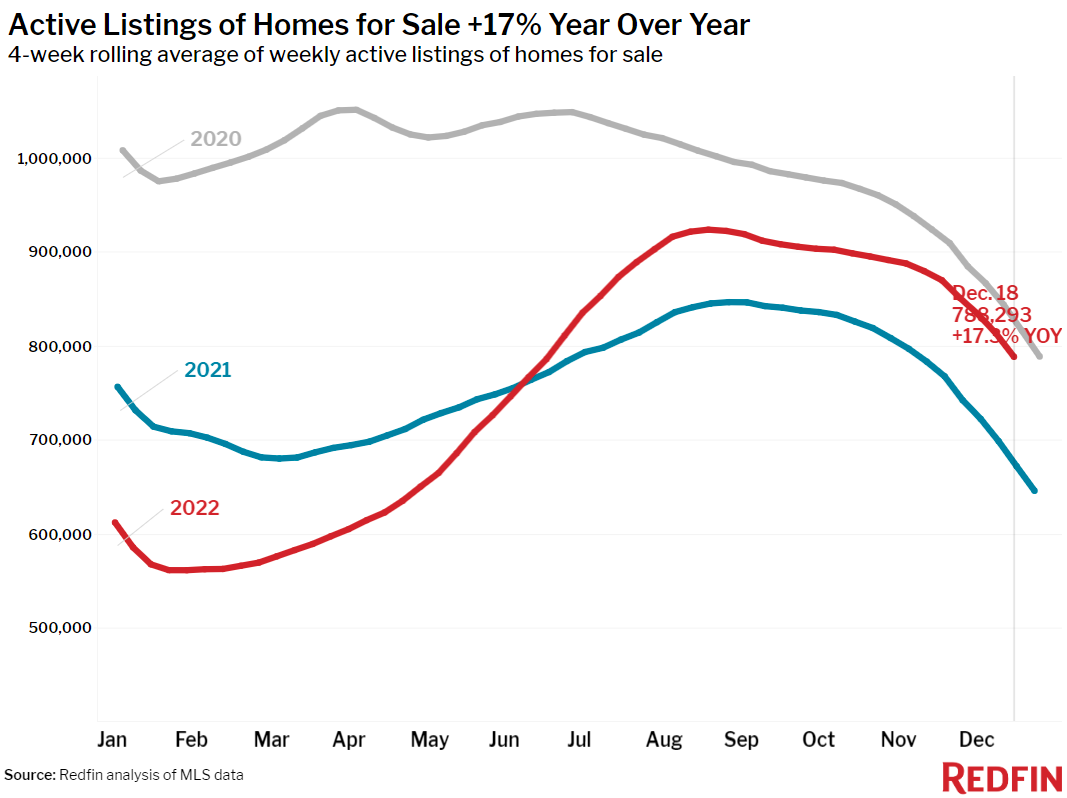
- New listings of homes for sale were down 22% from a year earlier, one of the largest declines since the start of the pandemic.
- Active listings (the number of homes listed for sale at any point during the period) were up 17.3% from a year earlier, the biggest annual increase since at least 2015.
- Months of supply—a measure of the balance between supply and demand, calculated by dividing the number of active listings by closed sales—was 3.7 months, up slightly from a week earlier and up from 2 months a year earlier.
- 28% of homes that went under contract had an accepted offer within the first two weeks on the market, down from 37% a year earlier and the lowest share since January 2020.
- Homes that sold were on the market for a median of 39 days, up more than a week from 29 days a year earlier and up from the record low of 17 days set in May and early June.
- 24% of homes sold above their final list price, down from 41% a year earlier and the lowest level since June 2020.
- On average, 5.1% of homes for sale each week had a price drop, down sharply from 5.6% a week earlier and 7% a month earlier. It’s up from 2.3% a year earlier.
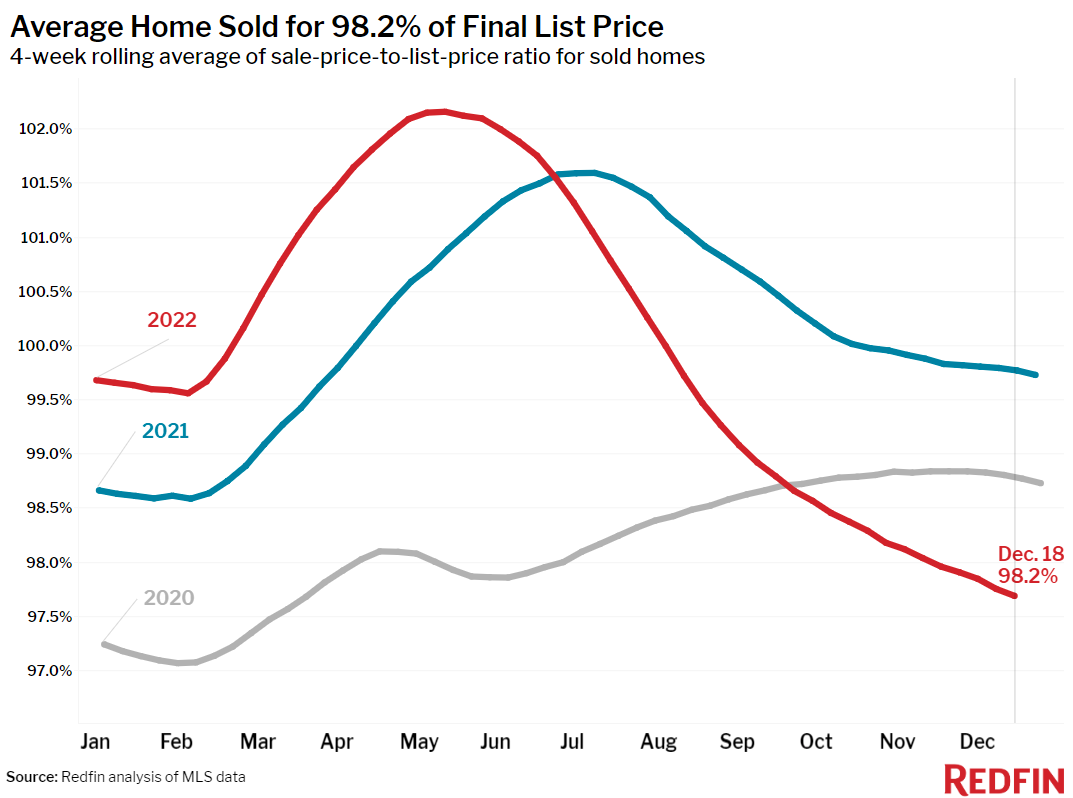
- The average sale-to-list price ratio, which measures how close homes are selling to their final asking prices, fell to 98.2% from 100.3% a year earlier. That’s the lowest level since March 2020.
To read the full report, including more data, charts and methodology, click here.


