


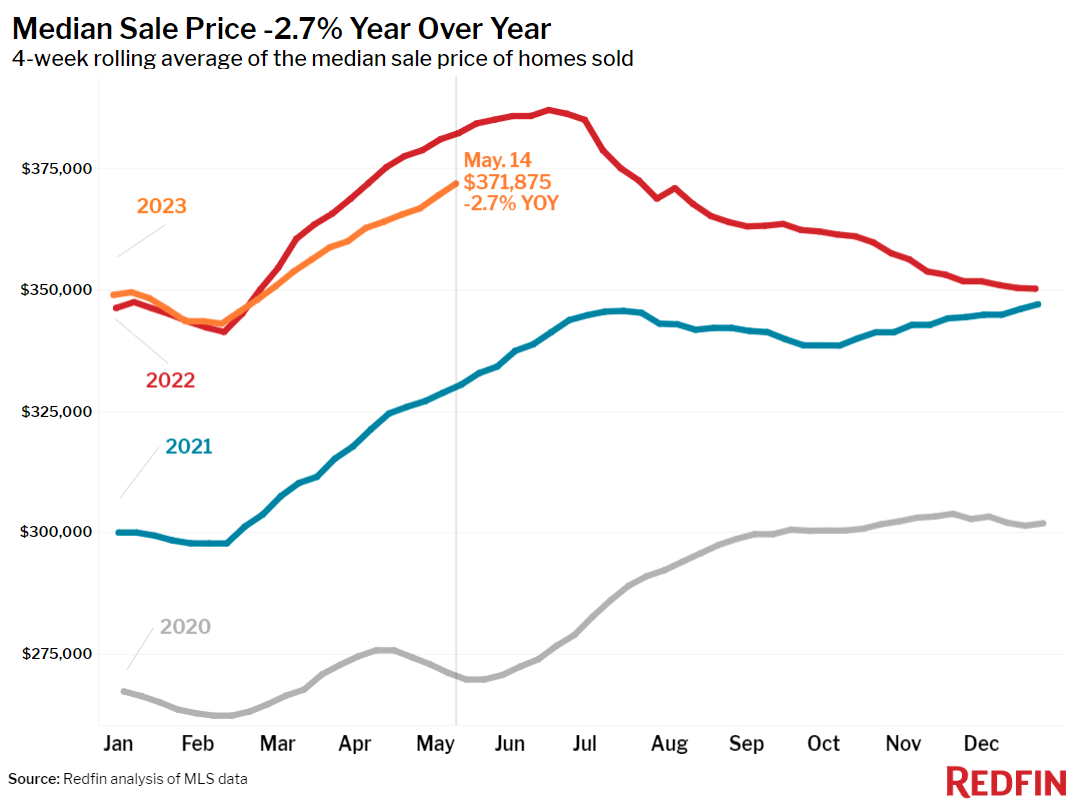
The median U.S. home-sale price fell 2.7% during the four weeks ending May 14, representing the smallest decline in over a month, according to a new report from Redfin. New data shows prices are dropping in fewer metros nationwide as mortgage rates continue to rise. That’s because there’s so little inventory hitting the market, leaving homeowners handcuffed to their houses by low rates.
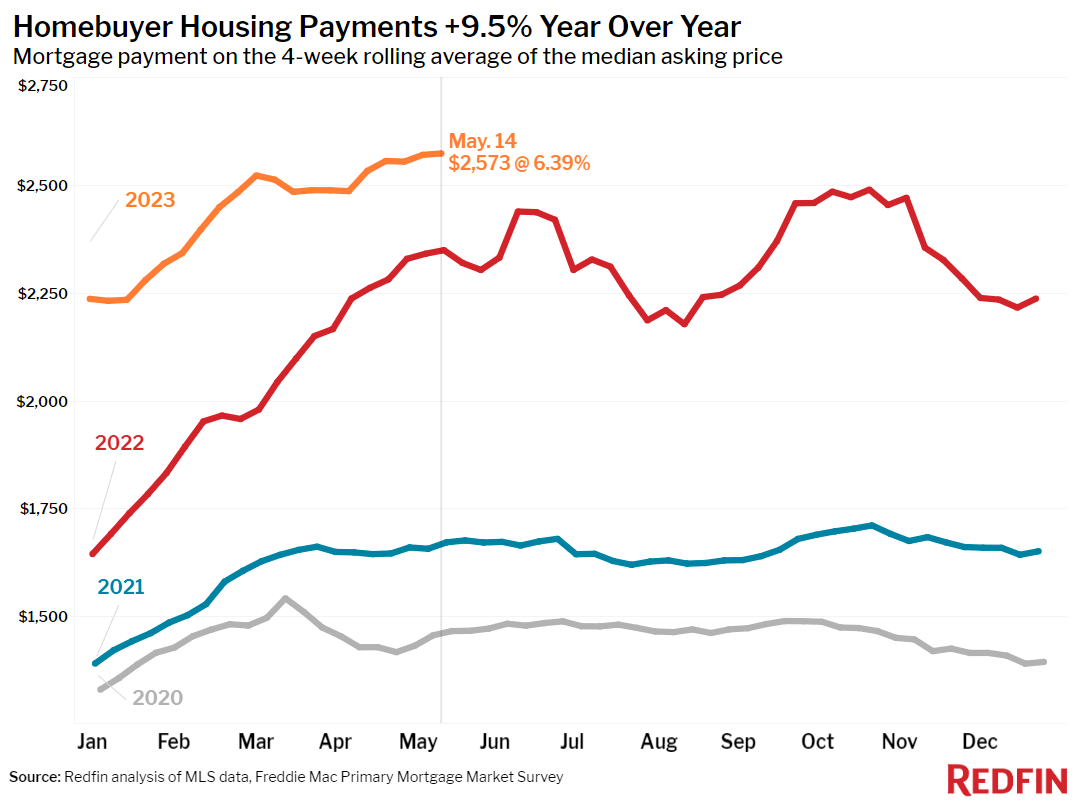
Monthly mortgage payments hit a record high due to still-high prices and elevated mortgage rates. On a local level, home prices are declining in 28 of the 50 most populous U.S. metros, down from a high of 32 metros at the end of April. That’s a reflection of a mismatch between demand and supply propping up prices. Pending home sales are also down 15% from a year earlier, but that’s much smaller than the 24% decline in new listings.
Today’s elevated mortgage rates continue to discourage homeowners from selling; nearly all of them have a mortgage rate below 6%, while this week’s average 30-year rate was 6.39%. The lack of new listings has drained inventory, with the total number of homes for sale dropping over the past two months, going against typical seasonal trends.
The share of homes selling that are doing so within two weeks (48%) is also bucking seasonal trends, illustrating urgency from buyers who don’t have much to choose from. That share has steadily increased over the last two months, while it typically falls this time of year.
“High mortgage rates continue to dictate the housing market. Although a lot of homebuyers have acclimated to rates in the 6% range and many are finding ways to lower their monthly payments, like using a 2-1 buydown, high rates are handcuffing potential sellers,” said Redfin Deputy Chief Economist Taylor Marr. “It’s hard to imagine a flood of new listings until rates come down at least into the 5s. For those who are selling now, the silver lining of giving up a low rate is that hardly anyone else is doing the same thing. That means buyers, who are hungry for new listings, will bite—and they don’t have much power to negotiate the price down.”
Leading indicators of homebuying activity:
- For the week ending May 18, the average 30-year fixed mortgage rate was 6.39%, up slightly from 6.35% the week before and back to the same level as two weeks before. The daily average was 6.7% on May 17.
- Mortgage-purchase applications during the week ending May 12 decreased 5% from a week earlier, seasonally adjusted. Purchase applications were down 26% from a year earlier.
- The seasonally adjusted Redfin Homebuyer Demand Index—a measure of requests for home tours and other homebuying services from Redfin agents—was down 2% from a week earlier during the week ending May 14, though the decline was largely due to Mother’s Day falling on this past Sunday. It was down 3% from a year earlier.
- Google searches for “homes for sale” were little changed from a month earlier during the week ending May 13, and down about 16% from a year earlier.
- Touring activity as of May 13 was up 20% from the start of the year, compared with an 8% increase at the same time last year, according to home tour technology company ShowingTime.
Newly built homes could help alleviate the inventory shortage even if rates remain elevated, and there are signs more may be coming. U.S. homebuilder confidence rose for the fifth straight month in May, hitting its highest level in nearly a year, and permits for single-family homes rose to a seven-month high in April.
Housing-market trends are playing out differently in different parts of the country, but agents in most metros are reporting that demand is outpacing supply. In Boise, ID, which had one of the hottest markets in the country during the pandemic, Redfin Premier agent Shauna Pendleton says today’s homebuyers are having a hard time finding homes because homeowners are sitting on 3% mortgage rates and aren’t moving unless they’re leaving the state.
“I’m practically begging potential sellers to list, especially those in the more affordable price point because those are the homes buyers are hungry for,” Pendleton said. “Every listing I’ve had since January priced at under $400,000 has had multiple offers within a few days on the market. I listed a home at the end of April at $399,900 and we ended up with four offers by the fourth day; it ended up going for $10,000 over list price. I even listed one at $650,000 that got multiple offers and went pending in under 48 hours.”
In Fort Lauderdale, FL, home prices are up 9% year-over-year, more than anywhere else in the U.S. except Milwaukee. Redfin team manager Andrea Duke said Fort Lauderdale prices are holding up well because South Florida is a popular destination. “There’s almost always demand for this area because people move here for the weather, and a lot of them pay in cash,” Duke said. “If a home is priced well and it’s in great shape, the seller will get multiple offers. But the market isn’t quite as hot as it was last year; most buyers are still including contingencies in their offers.”
Key housing market takeaways for 400+ U.S. metro areas:
- The median home sale price was $371,875, down 2.7% from a year earlier, the smallest decline in a month. Prices are up about 7% from the start of the year, a typical seasonal increase.
- Home-sale prices declined in 28 metros, with the biggest drops in Austin, TX (-17.8% YoY), Oakland, CA (-16.3%), San Francisco (-13.1%), Las Vegas (-11.4%) and San Jose, CA (-9.6%). Those are the biggest declines since at least 2015 for Oakland and Las Vegas.
- Sale prices increased most in Milwaukee (9.2%), Fort Lauderdale, FL (9%), New Brunswick, NJ (6.4%), Indianapolis (4.9%) and Newark, NJ (4.4%).
- The median asking price of newly listed homes was $398,429, down 0.3% from a year earlier. Although it’s small, that’s the first time asking prices have posted an annual decline since May 2020.
- The monthly mortgage payment on the median-asking-price home hit a record high of $2,573 at a 6.39% mortgage rate, the current weekly average. That’s up 9.5% ($224) from a year earlier.
- Pending home sales were down 14.6% year over year, the smallest decline in two months. That doesn’t necessarily mean pending sales are improving; instead, it reflects buyers backing off last spring as mortgage rates rose.
- Pending home sales fell in all metros Redfin analyzed. They declined most in Seattle (-33.4%), San Diego (-31.2%), Portland, OR (-28.9%), Sacramento, CA (-27.9%), and Milwaukee, WI (-27.3%).
- New listings of homes for sale fell 24.3% year over year, the second-biggest decline since May 2020 (the biggest was during the four weeks ending April 9, which included the Easter holiday).
- New listings declined in all metros Redfin analyzed. They fell most in Seattle (-42.9% YoY), San Diego (-41.2%), Oakland, CA (-41.1%), Las Vegas (-40.8%) and Anaheim, CA (-39.3%).
- Active listings (the number of homes listed for sale at any point during the period) were up 1.8% from a year earlier, the smallest increase since last June. Active listings fell slightly (-0.4%) from a month earlier; typically, they post month-over-month increases at this time of year.
- Months of supply — a measure of the balance between supply and demand, calculated by the number of months it would take for the current inventory to sell at the current sales pace — was 2.7 months, up from 2 months a year earlier. Four to five months of supply is considered balanced, with a lower number indicating seller’s market conditions.
- 48.4% of homes that went under contract had an accepted offer within the first two weeks on the market, down just slightly from 50% a year earlier and up from 46% a month earlier. Typically, we see month-over-month declines at this time of year; in all but two of the last eight years, this metric peaked in March.
- Homes that sold were on the market for a median of 31 days, the shortest span since September. That’s up from a record low of 18 days a year earlier.
- 32.9% of homes sold above their final list price. That’s the highest share since September but is down from 54% a year earlier.
- On average, 5.1% of homes for sale each week had a price drop, up from 3.4% a year earlier.
- The average sale-to-list price ratio, which measures how close homes are selling to their final asking prices, was 99.5%. That’s the highest level since September but is down from 102.6% a year earlier.
With such scarce inventory hitting the market, homeowners remain handcuffed to their houses by low rates as mortgage rates continue to rise, making homeownership difficult for many Americans.
To view the full report, including more data, charts and methodology, click here.


